| . |
. |
Number of People who has voted until 16:30 |
. |
. |
| . |
. |
| . |
. |
. |
. |
. |
. |
. |
. |
. |
. |
. |
. |
. |
. |
. |
. |
| Polska / Piła / szamotulski, pow. |
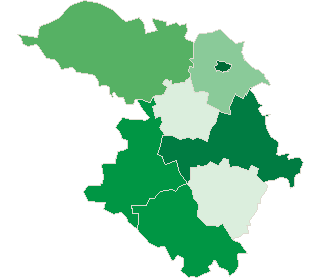 |
| szamotulski, pow. |
| Statistics on 30.06.2005 |
| Population: |
85353 |
| Area: |
1119.55 km2 |
| Population density: |
76 os/km2 |
| Election Statistic |
| No. of polling wards: |
52 |
No. of polling wards which
transmitted the results: |
52 |
| No. of people entitled to vote: |
68153 |
| No. of ballot papers issued: |
17628 |
25.87% |
|
| lack | 22.08% | 22.70% | 23.32% | 23.94% | 24.56% | 25.18% | 25.80% | 26.42% | 27.04% | 27.66% | | | . | . | . | . | . | . | . | . | . | . | . | . | | of data | 22.69% | 23.31% | 23.93% | 24.55% | 25.17% | 25.79% | 26.41% | 27.03% | 27.65% | 28.28% | |
|
See also:
|
| . |
. |
Number of people entitled to vote, number of ballot papers issued |
. |
. |
| . |
. |
| . |
. |
. |
. |
. |
. |
. |
. |
. |
. |
. |
. |
| No. |
Name |
No. of polling |
No. of people
entitled to vote |
No. of
ballot papers
issued |
No. of ballot papers issued / No. of people entitled to vote [%] |
| wards |
wards which
transmitted the results |
| 302402 | Duszniki, gm. | 4 | 4 | 6206 | 1640 | 26.43 |  |
| 302403 | Kaźmierz, gm. | 5 | 5 | 5289 | 1168 | 22.08 | |
| 302404 | Obrzycko, gm. | 2 | 2 | 3245 | 778 | 23.98 | |
| 302401 | Obrzycko, m. | 1 | 1 | 1762 | 498 | 28.26 | |
| 302405 | Ostroróg, gm. | 2 | 2 | 3748 | 832 | 22.20 | |
| 302406 | Pniewy, gm. | 7 | 7 | 9210 | 2458 | 26.69 | |
| 302407 | Szamotuły, gm. | 17 | 17 | 22408 | 6090 | 27.18 | |
| 302408 | Wronki, gm. | 14 | 14 | 16285 | 4164 | 25.57 | |
| |
szamotulski, pow. |
52 |
52 |
68153 |
17628 |
25.87 |
 |
|
| |
| . |
. |
Turnout by location of ward electoral commission |
. |
. |
| . |
. |
| . |
. |
. |
. |
. |
. |
. |
. |
. |
. |
. |
. |
| No. |
Name |
No. of polling |
No. of people
entitled to vote |
No. of
ballot papers
issued |
No. of ballot papers issued / No. of people entitled to vote [%] |
| wards |
wards which
transmitted the results |
| 1 | rural commune | 11 | 11 | 14740 | 3586 | 24.33 | |
| 2 | urban - rural commune | 40 | 40 | 51651 | 13544 | 26.22 | |
| 3 | urban commune | 1 | 1 | 1762 | 498 | 28.26 | |
|
|


 Legal Acts

 Legal Acts