| . |
. |
Number of People who has voted until 16:30 |
. |
. |
| . |
. |
| . |
. |
. |
. |
. |
. |
. |
. |
. |
. |
. |
. |
. |
. |
. |
. |
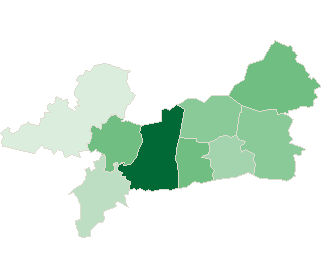
| Polska / Piła / pilski, pow. |
 |
| pilski, pow. |
| Statistics on 30.06.2005 |
| Population: |
137498 |
| Area: |
1267.1 km2 |
| Population density: |
108 os/km2 |
| Election Statistic |
| No. of polling wards: |
82 |
No. of polling wards which
transmitted the results: |
82 |
| No. of people entitled to vote: |
106101 |
| No. of ballot papers issued: |
35984 |
33.91% |
|
| lack | 25.81% | 27.81% | 29.81% | 31.81% | 33.81% | 35.81% | 37.81% | 39.81% | 41.81% | 43.81% | | | . | . | . | . | . | . | . | . | . | . | . | . | | of data | 27.80% | 29.80% | 31.80% | 33.80% | 35.80% | 37.80% | 39.80% | 41.80% | 43.80% | 45.81% | |
|
See also:
|
| . |
. |
Number of people entitled to vote, number of ballot papers issued |
. |
. |
| . |
. |
| . |
. |
. |
. |
. |
. |
. |
. |
. |
. |
. |
. |
| No. |
Name |
No. of polling |
No. of people
entitled to vote |
No. of
ballot papers
issued |
No. of ballot papers issued / No. of people entitled to vote [%] |
| wards |
wards which
transmitted the results |
| 301902 | Białośliwie, gm. | 5 | 5 | 3644 | 1087 | 29.83 |  |
| 301903 | Kaczory, gm. | 5 | 5 | 5590 | 2557 | 45.74 | |
| 301904 | Łobżenica, gm. | 6 | 6 | 7478 | 2662 | 35.60 | |
| 301905 | Miasteczko Krajeńskie, gm. | 3 | 3 | 2442 | 873 | 35.75 | |
| 301901 | Piła, m. | 35 | 35 | 59285 | 20386 | 34.39 | |
| 301906 | Szydłowo, gm. | 7 | 7 | 5594 | 1444 | 25.81 | |
| 301907 | Ujście, gm. | 7 | 7 | 6163 | 1760 | 28.56 | |
| 301908 | Wyrzysk, gm. | 11 | 11 | 10766 | 3517 | 32.67 | |
| 301909 | Wysoka, gm. | 3 | 3 | 5139 | 1698 | 33.04 | |
| |
pilski, pow. |
82 |
82 |
106101 |
35984 |
33.91 |
 |
|
| |
| . |
. |
Turnout by location of ward electoral commission |
. |
. |
| . |
. |
| . |
. |
. |
. |
. |
. |
. |
. |
. |
. |
. |
. |
| No. |
Name |
No. of polling |
No. of people
entitled to vote |
No. of
ballot papers
issued |
No. of ballot papers issued / No. of people entitled to vote [%] |
| wards |
wards which
transmitted the results |
| 1 | rural commune | 20 | 20 | 17270 | 5961 | 34.52 | |
| 2 | urban - rural commune | 27 | 27 | 29546 | 9637 | 32.62 | |
| 3 | urban commune | 35 | 35 | 59285 | 20386 | 34.39 | |
|
|


 Legal Acts

 Legal Acts