| . |
. |
Number of People who has voted until 16:30 |
. |
. |
| . |
. |
| . |
. |
. |
. |
. |
. |
. |
. |
. |
. |
. |
. |
. |
. |
. |
. |
| Polska / Sosnowiec / zawierciański, pow. |
 |
| zawierciański, pow. |
| Statistics on 30.06.2005 |
| Population: |
126259 |
| Area: |
1003.27 km2 |
| Population density: |
125 os/km2 |
| Election Statistic |
| No. of polling wards: |
90 |
No. of polling wards which
transmitted the results: |
90 |
| No. of people entitled to vote: |
103369 |
| No. of ballot papers issued: |
25934 |
25.09% |
|
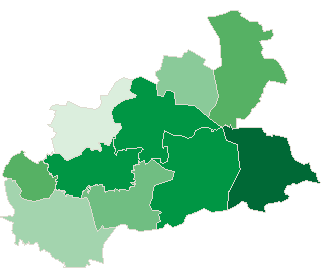
| lack | 17.81% | 19.04% | 20.27% | 21.50% | 22.73% | 23.96% | 25.19% | 26.42% | 27.65% | 28.88% | | | . | . | . | . | . | . | . | . | . | . | . | . | | of data | 19.03% | 20.26% | 21.49% | 22.72% | 23.95% | 25.18% | 26.41% | 27.64% | 28.87% | 30.11% | |
|
See also:
|
| . |
. |
Number of people entitled to vote, number of ballot papers issued |
. |
. |
| . |
. |
| . |
. |
. |
. |
. |
. |
. |
. |
. |
. |
. |
. |
| No. |
Name |
No. of polling |
No. of people
entitled to vote |
No. of
ballot papers
issued |
No. of ballot papers issued / No. of people entitled to vote [%] |
| wards |
wards which
transmitted the results |
| 241603 | Irządze, gm. | 3 | 3 | 2325 | 503 | 21.63 |  |
| 241604 | Kroczyce, gm. | 5 | 5 | 4827 | 1315 | 27.24 | |
| 241605 | Łazy, gm. | 10 | 10 | 13323 | 2792 | 20.96 | |
| 241606 | Ogrodzieniec, gm. | 6 | 6 | 7896 | 1879 | 23.80 | |
| 241607 | Pilica, gm. | 7 | 7 | 7560 | 2039 | 26.97 | |
| 241601 | Poręba, m. | 5 | 5 | 7360 | 1800 | 24.46 | |
| 241608 | Szczekociny, gm. | 9 | 9 | 6948 | 1747 | 25.14 | |
| 241609 | Włodowice, gm. | 4 | 4 | 4255 | 758 | 17.81 | |
| 241602 | Zawiercie, m. | 34 | 34 | 44908 | 11907 | 26.51 | |
| 241610 | Żarnowiec, gm. | 7 | 7 | 3967 | 1194 | 30.10 | |
| |
zawierciański, pow. |
90 |
90 |
103369 |
25934 |
25.09 |
 |
|
| |
| . |
. |
Turnout by location of ward electoral commission |
. |
. |
| . |
. |
| . |
. |
. |
. |
. |
. |
. |
. |
. |
. |
. |
. |
| No. |
Name |
No. of polling |
No. of people
entitled to vote |
No. of
ballot papers
issued |
No. of ballot papers issued / No. of people entitled to vote [%] |
| wards |
wards which
transmitted the results |
| 1 | rural commune | 19 | 19 | 15374 | 3770 | 24.52 | |
| 2 | urban - rural commune | 32 | 32 | 35727 | 8457 | 23.67 | |
| 3 | urban commune | 39 | 39 | 52268 | 13707 | 26.22 | |
|
|


 Legal Acts

 Legal Acts