| . |
. |
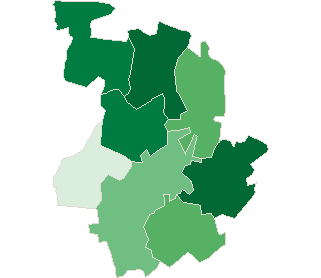
Number of People who has voted until 16:30 |
. |
. |
| . |
. |
| . |
. |
. |
. |
. |
. |
. |
. |
. |
. |
. |
. |
. |
. |
. |
. |
| Polska / Radom / przysuski, pow. |
 |
| przysuski, pow. |
| Statistics on 30.06.2005 |
| Population: |
46609 |
| Area: |
800.68 km2 |
| Population density: |
58 os/km2 |
| Election Statistic |
| No. of polling wards: |
36 |
No. of polling wards which
transmitted the results: |
36 |
| No. of people entitled to vote: |
35628 |
| No. of ballot papers issued: |
10949 |
30.73% |
|
| lack | 22.57% | 23.92% | 25.27% | 26.62% | 27.97% | 29.32% | 30.67% | 32.02% | 33.37% | 34.72% | | | . | . | . | . | . | . | . | . | . | . | . | . | | of data | 23.91% | 25.26% | 26.61% | 27.96% | 29.31% | 30.66% | 32.01% | 33.36% | 34.71% | 36.07% | |
|
See also:
|
| . |
. |
Number of people entitled to vote, number of ballot papers issued |
. |
. |
| . |
. |
| . |
. |
. |
. |
. |
. |
. |
. |
. |
. |
. |
. |
| No. |
Name |
No. of polling |
No. of people
entitled to vote |
No. of
ballot papers
issued |
No. of ballot papers issued / No. of people entitled to vote [%] |
| wards |
wards which
transmitted the results |
| 142301 | Borkowice, gm. | 4 | 4 | 3729 | 1100 | 29.50 |  |
| 142302 | Gielniów, gm. | 4 | 4 | 3996 | 902 | 22.57 | |
| 142303 | Klwów, gm. | 4 | 4 | 2914 | 1023 | 35.11 | |
| 142304 | Odrzywół, gm. | 4 | 4 | 3387 | 1143 | 33.75 | |
| 142305 | Potworów, gm. | 4 | 4 | 3322 | 1007 | 30.31 | |
| 142306 | Przysucha, gm. | 8 | 8 | 10451 | 3013 | 28.83 | |
| 142307 | Rusinów, gm. | 4 | 4 | 3514 | 1206 | 34.32 | |
| 142308 | Wieniawa, gm. | 4 | 4 | 4315 | 1555 | 36.04 | |
| |
przysuski, pow. |
36 |
36 |
35628 |
10949 |
30.73 |
 |
|
| |
| . |
. |
Turnout by location of ward electoral commission |
. |
. |
| . |
. |
| . |
. |
. |
. |
. |
. |
. |
. |
. |
. |
. |
. |
| No. |
Name |
No. of polling |
No. of people
entitled to vote |
No. of
ballot papers
issued |
No. of ballot papers issued / No. of people entitled to vote [%] |
| wards |
wards which
transmitted the results |
| 1 | rural commune | 28 | 28 | 25177 | 7936 | 31.52 | |
| 2 | urban - rural commune | 8 | 8 | 10451 | 3013 | 28.83 | |
|
|


 Legal Acts

 Legal Acts