| . |
. |
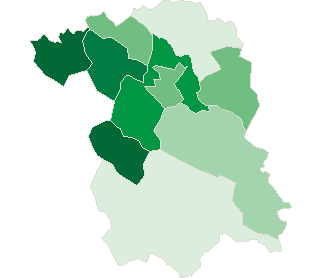
Number of People who has voted until 16:30 |
. |
. |
| . |
. |
| . |
. |
. |
. |
. |
. |
. |
. |
. |
. |
. |
. |
. |
. |
. |
. |
| Polska / Nowy Sącz / gorlicki, pow. |
 |
| gorlicki, pow. |
| Statistics on 30.06.2005 |
| Population: |
110125 |
| Area: |
967.36 km2 |
| Population density: |
113 os/km2 |
| Election Statistic |
| No. of polling wards: |
89 |
No. of polling wards which
transmitted the results: |
89 |
| No. of people entitled to vote: |
83596 |
| No. of ballot papers issued: |
27652 |
33.08% |
|
| lack | 27.72% | 28.81% | 29.90% | 30.99% | 32.08% | 33.17% | 34.26% | 35.35% | 36.44% | 37.53% | | | . | . | . | . | . | . | . | . | . | . | . | . | | of data | 28.80% | 29.89% | 30.98% | 32.07% | 33.16% | 34.25% | 35.34% | 36.43% | 37.52% | 38.62% | |
|
See also:
|
| . |
. |
Number of people entitled to vote, number of ballot papers issued |
. |
. |
| . |
. |
| . |
. |
. |
. |
. |
. |
. |
. |
. |
. |
. |
. |
| No. |
Name |
No. of polling |
No. of people
entitled to vote |
No. of
ballot papers
issued |
No. of ballot papers issued / No. of people entitled to vote [%] |
| wards |
wards which
transmitted the results |
| 120502 | Biecz, gm. | 13 | 13 | 13259 | 3789 | 28.58 |  |
| 120503 | Bobowa, gm. | 7 | 7 | 6654 | 2504 | 37.63 | |
| 120504 | Gorlice, gm. | 11 | 11 | 12376 | 4401 | 35.56 | |
| 120501 | Gorlice, m. | 22 | 22 | 24264 | 7948 | 32.76 | |
| 120505 | Lipinki, gm. | 7 | 7 | 5258 | 1728 | 32.86 | |
| 120506 | Łużna, gm. | 6 | 6 | 6154 | 2275 | 36.97 | |
| 120507 | Moszczenica, gm. | 3 | 3 | 3613 | 1180 | 32.66 | |
| 120508 | Ropa, gm. | 4 | 4 | 3620 | 1395 | 38.54 | |
| 120509 | Sękowa, gm. | 6 | 6 | 3658 | 1118 | 30.56 | |
| 120510 | Uście Gorlickie, gm. | 10 | 10 | 4740 | 1314 | 27.72 | |
| |
gorlicki, pow. |
89 |
89 |
83596 |
27652 |
33.08 |
 |
|
| |
| . |
. |
Turnout by location of ward electoral commission |
. |
. |
| . |
. |
| . |
. |
. |
. |
. |
. |
. |
. |
. |
. |
. |
. |
| No. |
Name |
No. of polling |
No. of people
entitled to vote |
No. of
ballot papers
issued |
No. of ballot papers issued / No. of people entitled to vote [%] |
| wards |
wards which
transmitted the results |
| 1 | rural commune | 54 | 54 | 46073 | 15915 | 34.54 | |
| 2 | urban - rural commune | 13 | 13 | 13259 | 3789 | 28.58 | |
| 3 | urban commune | 22 | 22 | 24264 | 7948 | 32.76 | |
|
|


 Legal Acts

 Legal Acts