| . |
. |
Number of People who has voted until 16:30 |
. |
. |
| . |
. |
| . |
. |
. |
. |
. |
. |
. |
. |
. |
. |
. |
. |
. |
. |
. |
. |
| Polska / Chełm / zamojski, pow. |
 |
| zamojski, pow. |
| Statistics on 30.06.2005 |
| Population: |
113493 |
| Area: |
1872.27 km2 |
| Population density: |
60 os/km2 |
| Election Statistic |
| No. of polling wards: |
110 |
No. of polling wards which
transmitted the results: |
110 |
| No. of people entitled to vote: |
87796 |
| No. of ballot papers issued: |
25188 |
28.69% |
|
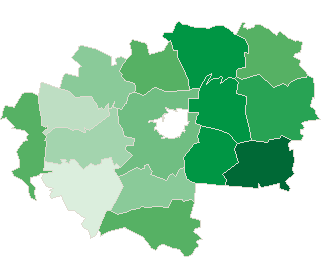
| lack | 20.83% | 22.45% | 24.07% | 25.69% | 27.31% | 28.93% | 30.55% | 32.17% | 33.79% | 35.41% | | | . | . | . | . | . | . | . | . | . | . | . | . | | of data | 22.44% | 24.06% | 25.68% | 27.30% | 28.92% | 30.54% | 32.16% | 33.78% | 35.40% | 37.03% | |
|
See also:
|
| . |
. |
Number of people entitled to vote, number of ballot papers issued |
. |
. |
| . |
. |
| . |
. |
. |
. |
. |
. |
. |
. |
. |
. |
. |
. |
| No. |
Name |
No. of polling |
No. of people
entitled to vote |
No. of
ballot papers
issued |
No. of ballot papers issued / No. of people entitled to vote [%] |
| wards |
wards which
transmitted the results |
| 062001 | Adamów, gm. | 5 | 5 | 4037 | 1076 | 26.65 |  |
| 062002 | Grabowiec, gm. | 4 | 4 | 3825 | 1121 | 29.31 | |
| 062003 | Komarów-Osada, gm. | 7 | 7 | 4497 | 1662 | 36.96 | |
| 062004 | Krasnobród, gm. | 10 | 10 | 5622 | 1713 | 30.47 | |
| 062005 | Łabunie, gm. | 6 | 6 | 4768 | 1567 | 32.86 | |
| 062006 | Miączyn, gm. | 8 | 8 | 5012 | 1546 | 30.85 | |
| 062007 | Nielisz, gm. | 7 | 7 | 4950 | 1283 | 25.92 | |
| 062008 | Radecznica, gm. | 7 | 7 | 5523 | 1622 | 29.37 | |
| 062009 | Sitno, gm. | 6 | 6 | 5362 | 1807 | 33.70 | |
| 062010 | Skierbieszów, gm. | 6 | 6 | 4595 | 1500 | 32.64 | |
| 062011 | Stary Zamość, gm. | 6 | 6 | 4318 | 1285 | 29.76 | |
| 062012 | Sułów, gm. | 6 | 6 | 4224 | 968 | 22.92 | |
| 062013 | Szczebrzeszyn, gm. | 9 | 9 | 9709 | 2484 | 25.58 | |
| 062014 | Zamość, gm. | 18 | 18 | 15550 | 4345 | 27.94 | |
| 062015 | Zwierzyniec, gm. | 5 | 5 | 5804 | 1209 | 20.83 | |
| |
zamojski, pow. |
110 |
110 |
87796 |
25188 |
28.69 |
 |
|
| |
| . |
. |
Turnout by location of ward electoral commission |
. |
. |
| . |
. |
| . |
. |
. |
. |
. |
. |
. |
. |
. |
. |
. |
. |
| No. |
Name |
No. of polling |
No. of people
entitled to vote |
No. of
ballot papers
issued |
No. of ballot papers issued / No. of people entitled to vote [%] |
| wards |
wards which
transmitted the results |
| 1 | rural commune | 86 | 86 | 66661 | 19782 | 29.68 | |
| 2 | urban - rural commune | 24 | 24 | 21135 | 5406 | 25.58 | |
|
|


 Legal Acts

 Legal Acts