| . |
. |
Number of People who has voted until 16:30 |
. |
. |
| . |
. |
| . |
. |
. |
. |
. |
. |
. |
. |
. |
. |
. |
. |
. |
. |
. |
. |
| Polska / Lublin / opolski, pow. |
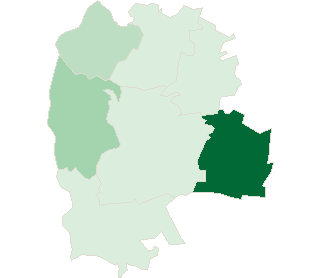 |
| opolski, pow. |
| Statistics on 30.06.2005 |
| Population: |
65562 |
| Area: |
811.2 km2 |
| Population density: |
80 os/km2 |
| Election Statistic |
| No. of polling wards: |
60 |
No. of polling wards which
transmitted the results: |
60 |
| No. of people entitled to vote: |
51113 |
| No. of ballot papers issued: |
13561 |
26.53% |
|
| lack | 25.28% | 26.07% | 26.86% | 27.65% | 28.44% | 29.23% | 30.02% | 30.81% | 31.60% | 32.39% | | | . | . | . | . | . | . | . | . | . | . | . | . | | of data | 26.06% | 26.85% | 27.64% | 28.43% | 29.22% | 30.01% | 30.80% | 31.59% | 32.38% | 33.18% | |
|
See also:
|
| . |
. |
Number of people entitled to vote, number of ballot papers issued |
. |
. |
| . |
. |
| . |
. |
. |
. |
. |
. |
. |
. |
. |
. |
. |
. |
| No. |
Name |
No. of polling |
No. of people
entitled to vote |
No. of
ballot papers
issued |
No. of ballot papers issued / No. of people entitled to vote [%] |
| wards |
wards which
transmitted the results |
| 061201 | Chodel, gm. | 5 | 5 | 5157 | 1709 | 33.14 |  |
| 061202 | Józefów nad Wisłą, gm. | 6 | 6 | 5791 | 1464 | 25.28 | |
| 061203 | Karczmiska, gm. | 6 | 6 | 4840 | 1242 | 25.66 | |
| 061204 | Łaziska, gm. | 6 | 6 | 4299 | 1166 | 27.12 | |
| 061205 | Opole Lubelskie, gm. | 16 | 16 | 14417 | 3663 | 25.41 | |
| 061206 | Poniatowa, gm. | 13 | 13 | 12640 | 3259 | 25.78 | |
| 061207 | Wilków, gm. | 8 | 8 | 3969 | 1058 | 26.66 | |
| |
opolski, pow. |
60 |
60 |
51113 |
13561 |
26.53 |
 |
|
| |
| . |
. |
Turnout by location of ward electoral commission |
. |
. |
| . |
. |
| . |
. |
. |
. |
. |
. |
. |
. |
. |
. |
. |
. |
| No. |
Name |
No. of polling |
No. of people
entitled to vote |
No. of
ballot papers
issued |
No. of ballot papers issued / No. of people entitled to vote [%] |
| wards |
wards which
transmitted the results |
| 1 | rural commune | 31 | 31 | 24056 | 6639 | 27.60 | |
| 2 | urban - rural commune | 29 | 29 | 27057 | 6922 | 25.58 | |
|
|


 Legal Acts

 Legal Acts