| . |
. |
Number of People who has voted until 16:30 |
. |
. |
| . |
. |
| . |
. |
. |
. |
. |
. |
. |
. |
. |
. |
. |
. |
. |
. |
. |
. |
| Polska / Wrocław / wrocławski, pow. |
 |
| wrocławski, pow. |
| Statistics on 30.06.2005 |
| Population: |
97858 |
| Area: |
1116.15 km2 |
| Population density: |
87 os/km2 |
| Election Statistic |
| No. of polling wards: |
63 |
No. of polling wards which
transmitted the results: |
63 |
| No. of people entitled to vote: |
76247 |
| No. of ballot papers issued: |
18803 |
24.66% |
|
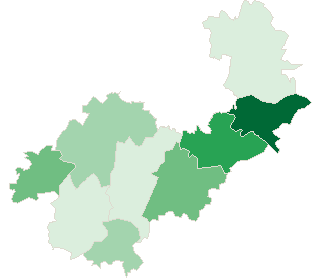
| lack | 23.26% | 23.74% | 24.22% | 24.70% | 25.18% | 25.66% | 26.14% | 26.62% | 27.10% | 27.58% | | | . | . | . | . | . | . | . | . | . | . | . | . | | of data | 23.73% | 24.21% | 24.69% | 25.17% | 25.65% | 26.13% | 26.61% | 27.09% | 27.57% | 28.06% | |
|
See also:
|
| . |
. |
Number of people entitled to vote, number of ballot papers issued |
. |
. |
| . |
. |
| . |
. |
. |
. |
. |
. |
. |
. |
. |
. |
. |
. |
| No. |
Name |
No. of polling |
No. of people
entitled to vote |
No. of
ballot papers
issued |
No. of ballot papers issued / No. of people entitled to vote [%] |
| wards |
wards which
transmitted the results |
| 022301 | Czernica, gm. | 5 | 5 | 6381 | 1784 | 27.96 |  |
| 022302 | Długołęka, gm. | 13 | 13 | 14970 | 3527 | 23.56 | |
| 022303 | Jordanów Śląski, gm. | 2 | 2 | 2374 | 576 | 24.26 | |
| 022304 | Kąty Wrocławskie, gm. | 9 | 9 | 13879 | 3384 | 24.38 | |
| 022305 | Kobierzyce, gm. | 9 | 9 | 10052 | 2360 | 23.48 | |
| 022306 | Mietków, gm. | 4 | 4 | 3028 | 764 | 25.23 | |
| 022307 | Sobótka, gm. | 6 | 6 | 9715 | 2260 | 23.26 | |
| 022308 | Święta Katarzyna, gm. | 9 | 9 | 10355 | 2751 | 26.57 | |
| 022309 | Żórawina, gm. | 6 | 6 | 5493 | 1397 | 25.43 | |
| |
wrocławski, pow. |
63 |
63 |
76247 |
18803 |
24.66 |
 |
|
| |
| . |
. |
Turnout by location of ward electoral commission |
. |
. |
| . |
. |
| . |
. |
. |
. |
. |
. |
. |
. |
. |
. |
. |
. |
| No. |
Name |
No. of polling |
No. of people
entitled to vote |
No. of
ballot papers
issued |
No. of ballot papers issued / No. of people entitled to vote [%] |
| wards |
wards which
transmitted the results |
| 1 | rural commune | 39 | 39 | 42298 | 10408 | 24.61 | |
| 2 | urban - rural commune | 24 | 24 | 33949 | 8395 | 24.73 | |
|
|


 Legal Acts

 Legal Acts