| . |
. |
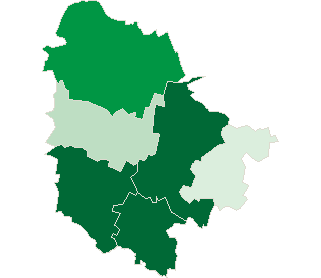
Number of People who has voted until 16:30 |
. |
. |
| . |
. |
| . |
. |
. |
. |
. |
. |
. |
. |
. |
. |
. |
. |
. |
. |
. |
. |
| Polska / Wrocław / trzebnicki, pow. |
 |
| trzebnicki, pow. |
| Statistics on 30.06.2005 |
| Population: |
77149 |
| Area: |
1025.55 km2 |
| Population density: |
75 os/km2 |
| Election Statistic |
| No. of polling wards: |
42 |
No. of polling wards which
transmitted the results: |
42 |
| No. of people entitled to vote: |
60324 |
| No. of ballot papers issued: |
13182 |
21.85% |
|
| lack | 17.25% | 17.86% | 18.47% | 19.08% | 19.69% | 20.30% | 20.91% | 21.52% | 22.13% | 22.74% | | | . | . | . | . | . | . | . | . | . | . | . | . | | of data | 17.85% | 18.46% | 19.07% | 19.68% | 20.29% | 20.90% | 21.51% | 22.12% | 22.73% | 23.35% | |
|
See also:
|
| . |
. |
Number of people entitled to vote, number of ballot papers issued |
. |
. |
| . |
. |
| . |
. |
. |
. |
. |
. |
. |
. |
. |
. |
. |
. |
| No. |
Name |
No. of polling |
No. of people
entitled to vote |
No. of
ballot papers
issued |
No. of ballot papers issued / No. of people entitled to vote [%] |
| wards |
wards which
transmitted the results |
| 022001 | Oborniki Śląskie, gm. | 10 | 10 | 13996 | 3224 | 23.04 |  |
| 022002 | Prusice, gm. | 5 | 5 | 7126 | 1289 | 18.09 | |
| 022003 | Trzebnica, gm. | 11 | 11 | 17220 | 4003 | 23.25 | |
| 022004 | Wisznia Mała, gm. | 4 | 4 | 6141 | 1422 | 23.16 | |
| 022005 | Zawonia, gm. | 3 | 3 | 4162 | 718 | 17.25 | |
| 022006 | Żmigród, gm. | 9 | 9 | 11679 | 2526 | 21.63 | |
| |
trzebnicki, pow. |
42 |
42 |
60324 |
13182 |
21.85 |
 |
|
| |
| . |
. |
Turnout by location of ward electoral commission |
. |
. |
| . |
. |
| . |
. |
. |
. |
. |
. |
. |
. |
. |
. |
. |
. |
| No. |
Name |
No. of polling |
No. of people
entitled to vote |
No. of
ballot papers
issued |
No. of ballot papers issued / No. of people entitled to vote [%] |
| wards |
wards which
transmitted the results |
| 1 | rural commune | 7 | 7 | 10303 | 2140 | 20.77 | |
| 2 | urban - rural commune | 35 | 35 | 50021 | 11042 | 22.07 | |
|
|


 Legal Acts

 Legal Acts