| . |
. |
Number of People who has voted until 10:30 |
. |
. |
| . |
. |
| . |
. |
. |
. |
. |
. |
. |
. |
. |
. |
. |
. |
. |
. |
. |
. |
| Polska / Lublin ... |
 |
| Lublin, okr. 6 |
| Statistics on 30.06.2005 |
| Population: |
1213725 |
| Area: |
9854.5 km2 |
| Population density: |
123 os/km2 |
| Election Statistic |
| No. of polling wards: |
915 |
No. of polling wards which
transmitted the results: |
915 |
| No. of people entitled to vote: |
956566 |
| No. of ballot papers issued: |
64383 |
6.73% |
|
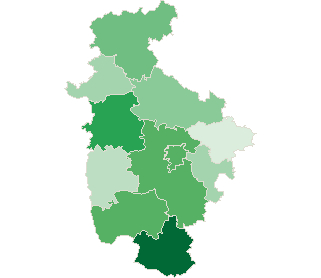
| lack | 4.79% | 5.19% | 5.59% | 5.99% | 6.39% | 6.79% | 7.19% | 7.59% | 7.99% | 8.39% | | | . | . | . | . | . | . | . | . | . | . | . | . | | of data | 5.18% | 5.58% | 5.98% | 6.38% | 6.78% | 7.18% | 7.58% | 7.98% | 8.38% | 8.79% | |
|
See also:
|
| . |
. |
Number of people entitled to vote, number of ballot papers issued |
. |
. |
| . |
. |
| . |
. |
. |
. |
. |
. |
. |
. |
. |
. |
. |
. |
| No. |
Name |
No. of polling |
No. of people
entitled to vote |
No. of
ballot papers
issued |
No. of ballot papers issued / No. of people entitled to vote [%] |
| wards |
wards which
transmitted the results |
| 060500 | janowski, pow. | 36 | 36 | 38328 | 3353 | 8.75 |  |
| 060700 | kraśnicki, pow. | 84 | 84 | 80543 | 5651 | 7.02 | |
| 060800 | lubartowski, pow. | 86 | 86 | 72037 | 4531 | 6.29 | |
| 060900 | lubelski, pow. | 119 | 119 | 106647 | 7435 | 6.97 | |
| 066301 | Lublin, m. | 192 | 192 | 279281 | 19812 | 7.09 | |
| 061000 | łęczyński, pow. | 47 | 47 | 43630 | 2091 | 4.79 | |
| 061100 | łukowski, pow. | 86 | 86 | 83901 | 5441 | 6.49 | |
| 061200 | opolski, pow. | 60 | 60 | 51077 | 2842 | 5.56 | |
| 061400 | puławski, pow. | 88 | 88 | 95032 | 7090 | 7.46 | |
| 061600 | rycki, pow. | 64 | 64 | 48044 | 2799 | 5.83 | |
| 061700 | świdnicki, pow. | 53 | 53 | 58046 | 3338 | 5.75 | |
| |
Lublin, okr. 6 |
915 |
915 |
956566 |
64383 |
6.73 |
 |
|
| |
| . |
. |
Turnout by location of ward electoral commission |
. |
. |
| . |
. |
| . |
. |
. |
. |
. |
. |
. |
. |
. |
. |
. |
. |
| No. |
Name |
No. of polling |
No. of people
entitled to vote |
No. of
ballot papers
issued |
No. of ballot papers issued / No. of people entitled to vote [%] |
| wards |
wards which
transmitted the results |
| 1 | rural commune | 462 | 462 | 377030 | 24836 | 6.59 | |
| 2 | urban - rural commune | 148 | 148 | 135229 | 8070 | 5.97 | |
| 3 | urban commune | 113 | 113 | 165026 | 11665 | 7.07 | |
| 4 | town with district rights | 192 | 192 | 279281 | 19812 | 7.09 | |
|
|


 Legal Acts

 Legal Acts