| . |
. |
Number of People who has voted until 10:30 |
. |
. |
| . |
. |
| . |
. |
. |
. |
. |
. |
. |
. |
. |
. |
. |
. |
. |
. |
. |
. |
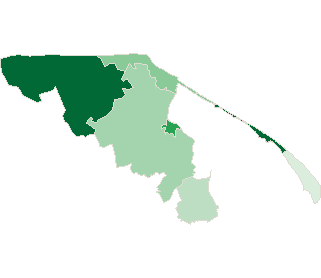
| Polska / Gdynia / pucki, pow. |
 |
| pucki, pow. |
| Statistics on 30.06.2005 |
| Population: |
73982 |
| Area: |
575.07 km2 |
| Population density: |
128 os/km2 |
| Election Statistic |
| No. of polling wards: |
47 |
No. of polling wards which
transmitted the results: |
47 |
| No. of people entitled to vote: |
55691 |
| No. of ballot papers issued: |
3959 |
7.11% |
|
| lack | 5.18% | 5.62% | 6.06% | 6.50% | 6.94% | 7.38% | 7.82% | 8.26% | 8.70% | 9.14% | | | . | . | . | . | . | . | . | . | . | . | . | . | | of data | 5.61% | 6.05% | 6.49% | 6.93% | 7.37% | 7.81% | 8.25% | 8.69% | 9.13% | 9.58% | |
|
See also:
|
| . |
. |
Number of people entitled to vote, number of ballot papers issued |
. |
. |
| . |
. |
| . |
. |
. |
. |
. |
. |
. |
. |
. |
. |
. |
. |
| No. |
Name |
No. of polling |
No. of people
entitled to vote |
No. of
ballot papers
issued |
No. of ballot papers issued / No. of people entitled to vote [%] |
| wards |
wards which
transmitted the results |
| 221101 | Hel, m. | 3 | 3 | 3437 | 178 | 5.18 |  |
| 221102 | Jastarnia, m. | 3 | 3 | 3169 | 301 | 9.50 | |
| 221105 | Kosakowo, gm. | 4 | 4 | 5856 | 352 | 6.01 | |
| 221106 | Krokowa, gm. | 6 | 6 | 7299 | 669 | 9.17 | |
| 221107 | Puck, gm. | 13 | 13 | 15358 | 983 | 6.40 | |
| 221103 | Puck, m. | 7 | 7 | 9192 | 723 | 7.87 | |
| 221104 | Władysławowo, m. | 11 | 11 | 11380 | 753 | 6.62 | |
| |
pucki, pow. |
47 |
47 |
55691 |
3959 |
7.11 |
 |
|
| |
| . |
. |
Turnout by location of ward electoral commission |
. |
. |
| . |
. |
| . |
. |
. |
. |
. |
. |
. |
. |
. |
. |
. |
. |
| No. |
Name |
No. of polling |
No. of people
entitled to vote |
No. of
ballot papers
issued |
No. of ballot papers issued / No. of people entitled to vote [%] |
| wards |
wards which
transmitted the results |
| 1 | rural commune | 23 | 23 | 28513 | 2004 | 7.03 | |
| 2 | urban commune | 24 | 24 | 27178 | 1955 | 7.19 | |
|
|


 Legal Acts

 Legal Acts