| . |
. |
Number of People who has voted until 10:30 |
. |
. |
| . |
. |
| . |
. |
. |
. |
. |
. |
. |
. |
. |
. |
. |
. |
. |
. |
. |
. |
| Polska / Nowy Sącz / gorlicki, pow. |
 |
| gorlicki, pow. |
| Statistics on 30.06.2005 |
| Population: |
110125 |
| Area: |
967.36 km2 |
| Population density: |
113 os/km2 |
| Election Statistic |
| No. of polling wards: |
89 |
No. of polling wards which
transmitted the results: |
89 |
| No. of people entitled to vote: |
83468 |
| No. of ballot papers issued: |
10351 |
12.40% |
|
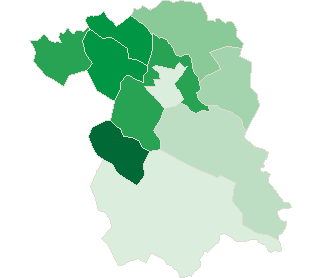
| lack | 9.06% | 9.93% | 10.80% | 11.67% | 12.54% | 13.41% | 14.28% | 15.15% | 16.02% | 16.89% | | | . | . | . | . | . | . | . | . | . | . | . | . | | of data | 9.92% | 10.79% | 11.66% | 12.53% | 13.40% | 14.27% | 15.14% | 16.01% | 16.88% | 17.76% | |
|
See also:
|
| . |
. |
Number of people entitled to vote, number of ballot papers issued |
. |
. |
| . |
. |
| . |
. |
. |
. |
. |
. |
. |
. |
. |
. |
. |
. |
| No. |
Name |
No. of polling |
No. of people
entitled to vote |
No. of
ballot papers
issued |
No. of ballot papers issued / No. of people entitled to vote [%] |
| wards |
wards which
transmitted the results |
| 120502 | Biecz, gm. | 13 | 13 | 13257 | 1583 | 11.94 |  |
| 120503 | Bobowa, gm. | 7 | 7 | 6641 | 980 | 14.76 | |
| 120504 | Gorlice, gm. | 11 | 11 | 12369 | 1834 | 14.83 | |
| 120501 | Gorlice, m. | 22 | 22 | 24226 | 2394 | 9.88 | |
| 120505 | Lipinki, gm. | 7 | 7 | 5255 | 568 | 10.81 | |
| 120506 | Łużna, gm. | 6 | 6 | 6147 | 982 | 15.98 | |
| 120507 | Moszczenica, gm. | 3 | 3 | 3608 | 563 | 15.60 | |
| 120508 | Ropa, gm. | 4 | 4 | 3608 | 638 | 17.68 | |
| 120509 | Sękowa, gm. | 6 | 6 | 3655 | 383 | 10.48 | |
| 120510 | Uście Gorlickie, gm. | 10 | 10 | 4702 | 426 | 9.06 | |
| |
gorlicki, pow. |
89 |
89 |
83468 |
10351 |
12.40 |
 |
|
| |
| . |
. |
Turnout by location of ward electoral commission |
. |
. |
| . |
. |
| . |
. |
. |
. |
. |
. |
. |
. |
. |
. |
. |
. |
| No. |
Name |
No. of polling |
No. of people
entitled to vote |
No. of
ballot papers
issued |
No. of ballot papers issued / No. of people entitled to vote [%] |
| wards |
wards which
transmitted the results |
| 1 | rural commune | 54 | 54 | 45985 | 6374 | 13.86 | |
| 2 | urban - rural commune | 13 | 13 | 13257 | 1583 | 11.94 | |
| 3 | urban commune | 22 | 22 | 24226 | 2394 | 9.88 | |
|
|


 Legal Acts

 Legal Acts