| . |
. |
Turnout in Election to The Senate |
. |
. |
| . |
. |
| . |
. |
. |
. |
. |
. |
. |
. |
. |
. |
. |
. |
. |
. |
. |
. |
| Polska / Piła / wągrowiecki, pow. ... |
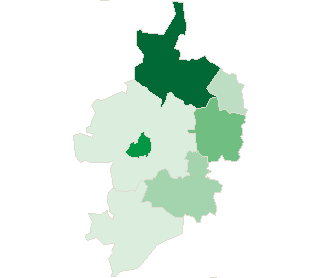 |
| wągrowiecki, pow. |
| Statistics on 30.06.2005 |
| Population: |
68352 |
| Area: |
1040.8 km2 |
| Population density: |
65 os/km2 |
| Summary voting results |
| No. of polling wards: |
42 |
No. of polling wards which
transmitted the results: |
42 |
| No. of people entitled to vote: |
52005 |
| No. of ballot papers issued: |
20820 |
40.03% |
|
| lack | 35.39% | 36.38% | 37.37% | 38.36% | 39.35% | 40.34% | 41.33% | 42.32% | 43.31% | 44.30% | | | . | . | . | . | . | . | . | . | . | . | . | . | | of data | 36.37% | 37.36% | 38.35% | 39.34% | 40.33% | 41.32% | 42.31% | 43.30% | 44.29% | 45.29% | |
|
See also:
|
| . |
. |
Voting results |
. |
. |
| . |
. |
| . |
. |
. |
. |
. |
. |
. |
. |
. |
. |
. |
. |
| No. |
Name |
No. entitled
to vote |
No. of ballot
papers issued |
No. of |
No. of ballot papers issued / No. entitled to vote
[%] |
| total votes |
valid votes |
| 302802 | Damasławek, gm. | 4381 | 1750 | 1746 | 1670 | 39.95 |  |
| 302803 | Gołańcz, gm. | 6410 | 2903 | 2901 | 2856 | 45.29 | |
| 302804 | Mieścisko, gm. | 4464 | 1684 | 1683 | 1620 | 37.72 | |
| 302805 | Skoki, gm. | 6444 | 2323 | 2322 | 2270 | 36.05 | |
| 302806 | Wapno, gm. | 2460 | 911 | 911 | 877 | 37.03 | |
| 302807 | Wągrowiec, gm. | 8410 | 2977 | 2974 | 2874 | 35.40 | |
| 302801 | Wągrowiec, m. | 19436 | 8272 | 8266 | 7968 | 42.56 | |
| |
wągrowiecki, pow. |
52005 |
20820 |
20803 |
20135 |
40.03 |
 |
|
| |
| . |
. |
Turnout by location of ward electoral commission |
. |
. |
| . |
. |
| . |
. |
. |
. |
. |
. |
. |
. |
. |
. |
. |
. |
| No. |
Name |
No. entitled
to vote |
No. of ballot
papers issued |
No. of |
No. of ballot papers issued / No. entitled to vote
[%] |
| total votes |
valid votes |
| 1 | City | 26718 | 11626 | 11618 | 11260 | 43.51 | |
| 2 | Country | 25287 | 9194 | 9185 | 8875 | 36.36 | |
| . |
Turnout by number of inhabitants of commune |
|
| 1 | to 5 000 | 2460 | 911 | 911 | 877 | 37.03 | |
| 2 | from 5 001 to 10 000 | 21699 | 8660 | 8652 | 8416 | 39.91 | |
| 3 | from 10 001 to 20 000 | 8410 | 2977 | 2974 | 2874 | 35.40 | |
| 4 | from 20 001 to 50 000 | 19436 | 8272 | 8266 | 7968 | 42.56 | |
| 5 | from 50 001 to 100 000 | 0 | 0 | 0 | 0 | 0.00 | |
| 6 | from 100 001 to 200 000 | 0 | 0 | 0 | 0 | 0.00 | |
| 7 | from 200 001 to 500 000 | 0 | 0 | 0 | 0 | 0.00 | |
| 8 | over 500 000 | 0 | 0 | 0 | 0 | 0.00 | |
|
|


 Legal Acts

 Legal Acts