| . |
. |
Turnout in Election to The Senate |
. |
. |
| . |
. |
| . |
. |
. |
. |
. |
. |
. |
. |
. |
. |
. |
. |
. |
. |
. |
. |
| Polska / Gdynia / słupski, pow. ... |
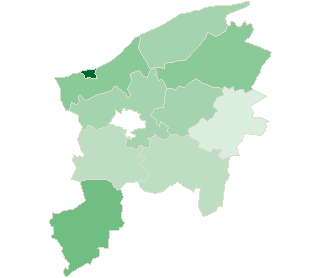 |
| słupski, pow. |
| Statistics on 30.06.2005 |
| Population: |
94256 |
| Area: |
2304 km2 |
| Population density: |
40 os/km2 |
| Summary voting results |
| No. of polling wards: |
71 |
No. of polling wards which
transmitted the results: |
71 |
| No. of people entitled to vote: |
72322 |
| No. of ballot papers issued: |
21946 |
30.34% |
|
| lack | 26.32% | 27.35% | 28.38% | 29.41% | 30.44% | 31.47% | 32.50% | 33.53% | 34.56% | 35.59% | | | . | . | . | . | . | . | . | . | . | . | . | . | | of data | 27.34% | 28.37% | 29.40% | 30.43% | 31.46% | 32.49% | 33.52% | 34.55% | 35.58% | 36.62% | |
|
See also:
|
| . |
. |
Voting results |
. |
. |
| . |
. |
| . |
. |
. |
. |
. |
. |
. |
. |
. |
. |
. |
. |
| No. |
Name |
No. entitled
to vote |
No. of ballot
papers issued |
No. of |
No. of ballot papers issued / No. entitled to vote
[%] |
| total votes |
valid votes |
| 221202 | Damnica, gm. | 4556 | 1293 | 1293 | 1245 | 28.38 |  |
| 221203 | Dębnica Kaszubska, gm. | 7160 | 1988 | 1986 | 1914 | 27.77 | |
| 221204 | Główczyce, gm. | 7201 | 2169 | 2168 | 2073 | 30.12 | |
| 221205 | Kępice, gm. | 7370 | 2279 | 2276 | 2165 | 30.92 | |
| 221206 | Kobylnica, gm. | 7475 | 2080 | 2080 | 2009 | 27.83 | |
| 221207 | Potęgowo, gm. | 5326 | 1402 | 1402 | 1371 | 26.32 | |
| 221208 | Słupsk, gm. | 10454 | 2986 | 2986 | 2886 | 28.56 | |
| 221209 | Smołdzino, gm. | 2718 | 788 | 788 | 747 | 28.99 | |
| 221210 | Ustka, gm. | 5638 | 1680 | 1679 | 1633 | 29.80 | |
| 221201 | Ustka, m. | 14424 | 5281 | 5241 | 5098 | 36.61 | |
| |
słupski, pow. |
72322 |
21946 |
21899 |
21141 |
30.34 |
 |
|
| |
| . |
. |
Turnout by location of ward electoral commission |
. |
. |
| . |
. |
| . |
. |
. |
. |
. |
. |
. |
. |
. |
. |
. |
. |
| No. |
Name |
No. entitled
to vote |
No. of ballot
papers issued |
No. of |
No. of ballot papers issued / No. entitled to vote
[%] |
| total votes |
valid votes |
| 1 | City | 17649 | 6422 | 6381 | 6164 | 36.39 | |
| 2 | Country | 54673 | 15524 | 15518 | 14977 | 28.39 | |
| . |
Turnout by number of inhabitants of commune |
|
| 1 | to 5 000 | 2718 | 788 | 788 | 747 | 28.99 | |
| 2 | from 5 001 to 10 000 | 44726 | 12891 | 12884 | 12410 | 28.82 | |
| 3 | from 10 001 to 20 000 | 24878 | 8267 | 8227 | 7984 | 33.23 | |
| 4 | from 20 001 to 50 000 | 0 | 0 | 0 | 0 | 0.00 | |
| 5 | from 50 001 to 100 000 | 0 | 0 | 0 | 0 | 0.00 | |
| 6 | from 100 001 to 200 000 | 0 | 0 | 0 | 0 | 0.00 | |
| 7 | from 200 001 to 500 000 | 0 | 0 | 0 | 0 | 0.00 | |
| 8 | over 500 000 | 0 | 0 | 0 | 0 | 0.00 | |
|
|


 Legal Acts

 Legal Acts