| . |
. |
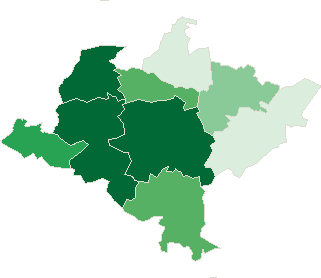
Turnout in Election to The Senate |
. |
. |
| . |
. |
| . |
. |
. |
. |
. |
. |
. |
. |
. |
. |
. |
. |
. |
. |
. |
. |
| Polska / Opole / nyski, pow. ... |
 |
| nyski, pow. |
| Statistics on 30.06.2005 |
| Population: |
147426 |
| Area: |
1223.87 km2 |
| Population density: |
120 os/km2 |
| Summary voting results |
| No. of polling wards: |
115 |
No. of polling wards which
transmitted the results: |
115 |
| No. of people entitled to vote: |
118239 |
| No. of ballot papers issued: |
42504 |
35.95% |
|
| lack | 28.11% | 29.24% | 30.37% | 31.50% | 32.63% | 33.76% | 34.89% | 36.02% | 37.15% | 38.28% | | | . | . | . | . | . | . | . | . | . | . | . | . | | of data | 29.23% | 30.36% | 31.49% | 32.62% | 33.75% | 34.88% | 36.01% | 37.14% | 38.27% | 39.41% | |
|
See also:
|
| . |
. |
Voting results |
. |
. |
| . |
. |
| . |
. |
. |
. |
. |
. |
. |
. |
. |
. |
. |
. |
| No. |
Name |
No. entitled
to vote |
No. of ballot
papers issued |
No. of |
No. of ballot papers issued / No. entitled to vote
[%] |
| total votes |
valid votes |
| 160701 | Głuchołazy, gm. | 21249 | 7277 | 7269 | 6954 | 34.25 |  |
| 160702 | Kamiennik, gm. | 2990 | 1146 | 1146 | 1074 | 38.33 | |
| 160703 | Korfantów, gm. | 7736 | 2175 | 2175 | 2069 | 28.12 | |
| 160704 | Łambinowice, gm. | 6266 | 2038 | 2034 | 1940 | 32.52 | |
| 160705 | Nysa, gm. | 49317 | 18960 | 18937 | 18333 | 38.45 | |
| 160706 | Otmuchów, gm. | 11585 | 4558 | 4555 | 4284 | 39.34 | |
| 160707 | Paczków, gm. | 11028 | 3865 | 3830 | 3616 | 35.05 | |
| 160708 | Pakosławice, gm. | 3009 | 1023 | 1022 | 996 | 34.00 | |
| 160709 | Skoroszyce, gm. | 5059 | 1462 | 1440 | 1359 | 28.90 | |
| |
nyski, pow. |
118239 |
42504 |
42408 |
40625 |
35.95 |
 |
|
| |
| . |
. |
Turnout by location of ward electoral commission |
. |
. |
| . |
. |
| . |
. |
. |
. |
. |
. |
. |
. |
. |
. |
. |
. |
| No. |
Name |
No. entitled
to vote |
No. of ballot
papers issued |
No. of |
No. of ballot papers issued / No. entitled to vote
[%] |
| total votes |
valid votes |
| 1 | City | 66393 | 25194 | 25136 | 24104 | 37.95 | |
| 2 | Country | 51846 | 17310 | 17272 | 16521 | 33.39 | |
| . |
Turnout by number of inhabitants of commune |
|
| 1 | to 5 000 | 5999 | 2169 | 2168 | 2070 | 36.16 | |
| 2 | from 5 001 to 10 000 | 19061 | 5675 | 5649 | 5368 | 29.77 | |
| 3 | from 10 001 to 20 000 | 22613 | 8423 | 8385 | 7900 | 37.25 | |
| 4 | from 20 001 to 50 000 | 21249 | 7277 | 7269 | 6954 | 34.25 | |
| 5 | from 50 001 to 100 000 | 49317 | 18960 | 18937 | 18333 | 38.45 | |
| 6 | from 100 001 to 200 000 | 0 | 0 | 0 | 0 | 0.00 | |
| 7 | from 200 001 to 500 000 | 0 | 0 | 0 | 0 | 0.00 | |
| 8 | over 500 000 | 0 | 0 | 0 | 0 | 0.00 | |
|
|


 Legal Acts

 Legal Acts