| . |
. |
Voting Results for Committee |
. |
. |
| . |
. |
| . |
. |
. |
. |
. |
. |
. |
. |
. |
. |
. |
. |
. |
. |
. |
. |
| Polska / Lublin / puławski, pow. ... |
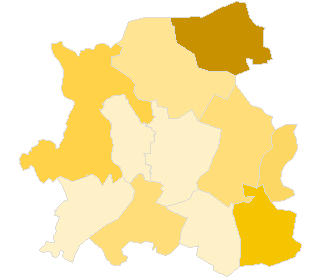 |
| Komitet Wyborczy Centrum |
| List's Number: |
11 |
| No. of valid votes: |
38641 |
| No. of votes per List: |
43 |
0.11% |
|
| lack | 0.00% | 0.05% | 0.10% | 0.15% | 0.20% | 0.25% | 0.30% | 0.35% | 0.40% | 0.45% | not | | . | . | . | . | . | . | . | . | . | . | . | . | | of data | 0.04% | 0.09% | 0.14% | 0.19% | 0.24% | 0.29% | 0.34% | 0.39% | 0.44% | 0.50% | applicable |
|
See also:
|
| . |
. |
Voting Results for Committee. |
. |
. |
| . |
. |
| . |
. |
. |
. |
. |
. |
. |
. |
. |
. |
. |
. |
. |
| No. |
Name |
No. of entitled
to vote |
No. of ballot papers
issued |
No. of votes |
No. of votes: per list / valid [%] |
| total |
valid |
per List |
| 061402 | Baranów, gm. | 3366 | 1239 | 1239 | 1173 | 5 | 0.43 |  |
| 061403 | Janowiec, gm. | 2861 | 977 | 977 | 934 | 0 | 0.00 | |
| 061404 | Kazimierz Dolny, gm. | 5847 | 2025 | 2006 | 1928 | 3 | 0.16 | |
| 061405 | Końskowola, gm. | 7196 | 2833 | 2832 | 2719 | 1 | 0.04 | |
| 061406 | Kurów, gm. | 6330 | 2443 | 2442 | 2341 | 4 | 0.17 | |
| 061407 | Markuszów, gm. | 2397 | 1017 | 1015 | 950 | 2 | 0.21 | |
| 061408 | Nałęczów, gm. | 7901 | 3337 | 3336 | 3201 | 10 | 0.31 | |
| 061409 | Puławy, gm. | 8823 | 3130 | 3113 | 3014 | 8 | 0.27 | |
| 061401 | Puławy, m. | 41714 | 19280 | 19235 | 18886 | 8 | 0.04 | |
| 061410 | Wąwolnica, gm. | 3839 | 1609 | 1609 | 1517 | 0 | 0.00 | |
| 061411 | Żyrzyn, gm. | 5156 | 2090 | 2090 | 1978 | 2 | 0.10 | |
| |
puławski, pow. |
95430 |
39980 |
39894 |
38641 |
43 |
0.11 |
 |
|
| |
| . |
. |
Voting Results by location of ward electoral commission. |
. |
. |
| . |
. |
| . |
. |
. |
. |
. |
. |
. |
. |
. |
. |
. |
. |
. |
| No. |
Name |
No. of entitled
to vote |
No. of ballot
papers issued |
No. of votes |
No. of votes: per list / valid [%] |
| total |
valid |
per List |
| 1 | City | 49302 | 22731 | 22685 | 22218 | 14 | 0.06 | |
| 2 | Country | 46128 | 17249 | 17209 | 16423 | 29 | 0.18 | |
| . |
Voting Results by number of inhabitants of commune |
. |
| 1 | to 5 000 | 12463 | 4842 | 4840 | 4574 | 7 | 0.15 | |
| 2 | from 5 001 to 10 000 | 32430 | 12728 | 12706 | 12167 | 20 | 0.16 | |
| 3 | from 10 001 to 20 000 | 8823 | 3130 | 3113 | 3014 | 8 | 0.27 | |
| 4 | from 20 001 to 50 000 | 0 | 0 | 0 | 0 | 0 | 0.00 | |
| 5 | from 50 001 to 100 000 | 41714 | 19280 | 19235 | 18886 | 8 | 0.04 | |
| 6 | from 100 001 to 200 000 | 0 | 0 | 0 | 0 | 0 | 0.00 | |
| 7 | from 200 001 to 500 000 | 0 | 0 | 0 | 0 | 0 | 0.00 | |
| 8 | over 500 000 | 0 | 0 | 0 | 0 | 0 | 0.00 | |
|
|


 Legal Acts
 Legal Acts