| . |
. |
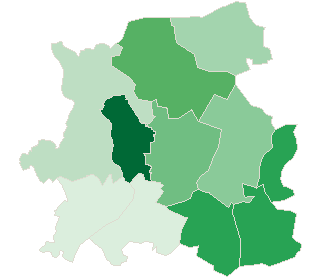
Turnout in Election to the Sejm |
. |
. |
| . |
. |
| . |
. |
. |
. |
. |
. |
. |
. |
. |
. |
. |
. |
. |
. |
. |
. |
| Polska / Lublin / puławski, pow. ... |
 |
| puławski, pow. |
| Statistics on 30.06.2005 |
| Population: |
119804 |
| Area: |
933 km2 |
| Population density: |
128 os/km2 |
| Summary voting results |
| No. of polling wards: |
88 |
No. of polling wards which
transmitted the results: |
88 |
| No. of people entitled to vote: |
95430 |
| No. of ballot papers issued: |
39980 |
41.89% |
|
| lack | 34.14% | 35.35% | 36.56% | 37.77% | 38.98% | 40.19% | 41.40% | 42.61% | 43.82% | 45.03% | | | . | . | . | . | . | . | . | . | . | . | . | . | | of data | 35.34% | 36.55% | 37.76% | 38.97% | 40.18% | 41.39% | 42.60% | 43.81% | 45.02% | 46.24% | |
|
See also:
|
| . |
. |
Voting results |
. |
. |
| . |
. |
| . |
. |
. |
. |
. |
. |
. |
. |
. |
. |
. |
. |
| No. |
Name |
No. entitled
to vote |
No. of ballot
papers issued |
No. of |
No. of ballot papers issued / No. entitled to vote
[%] |
| total votes |
valid votes |
| 061402 | Baranów, gm. | 3366 | 1239 | 1239 | 1173 | 36.81 |  |
| 061403 | Janowiec, gm. | 2861 | 977 | 977 | 934 | 34.15 | |
| 061404 | Kazimierz Dolny, gm. | 5847 | 2025 | 2006 | 1928 | 34.63 | |
| 061405 | Końskowola, gm. | 7196 | 2833 | 2832 | 2719 | 39.37 | |
| 061406 | Kurów, gm. | 6330 | 2443 | 2442 | 2341 | 38.59 | |
| 061407 | Markuszów, gm. | 2397 | 1017 | 1015 | 950 | 42.43 | |
| 061408 | Nałęczów, gm. | 7901 | 3337 | 3336 | 3201 | 42.24 | |
| 061409 | Puławy, gm. | 8823 | 3130 | 3113 | 3014 | 35.48 | |
| 061401 | Puławy, m. | 41714 | 19280 | 19235 | 18886 | 46.22 | |
| 061410 | Wąwolnica, gm. | 3839 | 1609 | 1609 | 1517 | 41.91 | |
| 061411 | Żyrzyn, gm. | 5156 | 2090 | 2090 | 1978 | 40.54 | |
| |
puławski, pow. |
95430 |
39980 |
39894 |
38641 |
41.89 |
 |
|
| |
| . |
. |
Turnout by location of ward electoral commission |
. |
. |
| . |
. |
| . |
. |
. |
. |
. |
. |
. |
. |
. |
. |
. |
. |
| No. |
Name |
No. entitled
to vote |
No. of ballot
papers issued |
No. of |
No. of ballot papers issued / No. entitled to vote
[%] |
| total votes |
valid votes |
| 1 | City | 49302 | 22731 | 22685 | 22218 | 46.11 | |
| 2 | Country | 46128 | 17249 | 17209 | 16423 | 37.39 | |
| . |
Turnout by number of inhabitants of commune |
. |
| 1 | to 5 000 | 12463 | 4842 | 4840 | 4574 | 38.85 | |
| 2 | from 5 001 to 10 000 | 32430 | 12728 | 12706 | 12167 | 39.25 | |
| 3 | from 10 001 to 20 000 | 8823 | 3130 | 3113 | 3014 | 35.48 | |
| 4 | from 20 001 to 50 000 | 0 | 0 | 0 | 0 | 0.00 | |
| 5 | from 50 001 to 100 000 | 41714 | 19280 | 19235 | 18886 | 46.22 | |
| 6 | from 100 001 to 200 000 | 0 | 0 | 0 | 0 | 0.00 | |
| 7 | from 200 001 to 500 000 | 0 | 0 | 0 | 0 | 0.00 | |
| 8 | over 500 000 | 0 | 0 | 0 | 0 | 0.00 | |
|
|


 Legal Acts

 Legal Acts