| . |
. |
Voting Results for Committee |
. |
. |
| . |
. |
| . |
. |
. |
. |
. |
. |
. |
. |
. |
. |
. |
. |
. |
. |
. |
. |
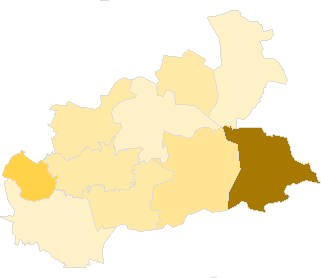
| Polska / Sosnowiec / zawierciański, pow. ... |
 |
| Komitet Wyborczy Sojusz Lewicy Demokratycznej |
| List's Number: |
7 |
| No. of valid votes: |
36414 |
| No. of votes per List: |
9647 |
26.49% |
|
| lack | 16.86% | 21.47% | 26.08% | 30.69% | 35.30% | 39.91% | 44.52% | 49.13% | 53.74% | 58.35% | not | | . | . | . | . | . | . | . | . | . | . | . | . | | of data | 21.46% | 26.07% | 30.68% | 35.29% | 39.90% | 44.51% | 49.12% | 53.73% | 58.34% | 62.96% | applicable |
|
See also:
|
| . |
. |
Voting Results for Committee. |
. |
. |
| . |
. |
| . |
. |
. |
. |
. |
. |
. |
. |
. |
. |
. |
. |
. |
| No. |
Name |
No. of entitled
to vote |
No. of ballot papers
issued |
No. of votes |
No. of votes: per list / valid [%] |
| total |
valid |
per List |
| 241603 | Irządze, gm. | 2330 | 723 | 722 | 662 | 163 | 24.62 |  |
| 241604 | Kroczyce, gm. | 4838 | 1807 | 1807 | 1702 | 287 | 16.86 | |
| 241605 | Łazy, gm. | 13327 | 4426 | 4421 | 4199 | 888 | 21.15 | |
| 241606 | Ogrodzieniec, gm. | 7902 | 2661 | 2657 | 2564 | 564 | 22.00 | |
| 241607 | Pilica, gm. | 7565 | 3031 | 3031 | 2921 | 896 | 30.67 | |
| 241601 | Poręba, m. | 7361 | 2762 | 2761 | 2657 | 1086 | 40.87 | |
| 241608 | Szczekociny, gm. | 6955 | 2661 | 2658 | 2538 | 519 | 20.45 | |
| 241609 | Włodowice, gm. | 4262 | 1194 | 1193 | 1127 | 279 | 24.76 | |
| 241602 | Zawiercie, m. | 44933 | 16803 | 16793 | 16179 | 3791 | 23.43 | |
| 241610 | Żarnowiec, gm. | 3984 | 1949 | 1948 | 1865 | 1174 | 62.95 | |
| |
zawierciański, pow. |
103457 |
38017 |
37991 |
36414 |
9647 |
26.49 |
 |
|
| |
| . |
. |
Voting Results by location of ward electoral commission. |
. |
. |
| . |
. |
| . |
. |
. |
. |
. |
. |
. |
. |
. |
. |
. |
. |
. |
| No. |
Name |
No. of entitled
to vote |
No. of ballot
papers issued |
No. of votes |
No. of votes: per list / valid [%] |
| total |
valid |
per List |
| 1 | City | 69026 | 25930 | 25913 | 24942 | 6290 | 25.22 | |
| 2 | Country | 34431 | 12087 | 12078 | 11472 | 3357 | 29.26 | |
| . |
Voting Results by number of inhabitants of commune |
. |
| 1 | to 5 000 | 2330 | 723 | 722 | 662 | 163 | 24.62 | |
| 2 | from 5 001 to 10 000 | 42867 | 16065 | 16055 | 15374 | 4805 | 31.25 | |
| 3 | from 10 001 to 20 000 | 13327 | 4426 | 4421 | 4199 | 888 | 21.15 | |
| 4 | from 20 001 to 50 000 | 0 | 0 | 0 | 0 | 0 | 0.00 | |
| 5 | from 50 001 to 100 000 | 44933 | 16803 | 16793 | 16179 | 3791 | 23.43 | |
| 6 | from 100 001 to 200 000 | 0 | 0 | 0 | 0 | 0 | 0.00 | |
| 7 | from 200 001 to 500 000 | 0 | 0 | 0 | 0 | 0 | 0.00 | |
| 8 | over 500 000 | 0 | 0 | 0 | 0 | 0 | 0.00 | |
|
|


 Legal Acts
 Legal Acts