| . |
. |
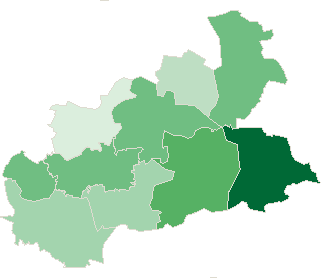
Turnout in Election to the Sejm |
. |
. |
| . |
. |
| . |
. |
. |
. |
. |
. |
. |
. |
. |
. |
. |
. |
. |
. |
. |
. |
| Polska / Sosnowiec / zawierciański, pow. ... |
 |
| zawierciański, pow. |
| Statistics on 30.06.2005 |
| Population: |
126259 |
| Area: |
1003.27 km2 |
| Population density: |
125 os/km2 |
| Summary voting results |
| No. of polling wards: |
90 |
No. of polling wards which
transmitted the results: |
90 |
| No. of people entitled to vote: |
103457 |
| No. of ballot papers issued: |
38017 |
36.75% |
|
| lack | 28.01% | 30.11% | 32.21% | 34.31% | 36.41% | 38.51% | 40.61% | 42.71% | 44.81% | 46.91% | | | . | . | . | . | . | . | . | . | . | . | . | . | | of data | 30.10% | 32.20% | 34.30% | 36.40% | 38.50% | 40.60% | 42.70% | 44.80% | 46.90% | 49.01% | |
|
See also:
|
| . |
. |
Voting results |
. |
. |
| . |
. |
| . |
. |
. |
. |
. |
. |
. |
. |
. |
. |
. |
. |
| No. |
Name |
No. entitled
to vote |
No. of ballot
papers issued |
No. of |
No. of ballot papers issued / No. entitled to vote
[%] |
| total votes |
valid votes |
| 241603 | Irządze, gm. | 2330 | 723 | 722 | 662 | 31.03 |  |
| 241604 | Kroczyce, gm. | 4838 | 1807 | 1807 | 1702 | 37.35 |  |
| 241605 | Łazy, gm. | 13327 | 4426 | 4421 | 4199 | 33.21 |  |
| 241606 | Ogrodzieniec, gm. | 7902 | 2661 | 2657 | 2564 | 33.68 |  |
| 241607 | Pilica, gm. | 7565 | 3031 | 3031 | 2921 | 40.07 |  |
| 241601 | Poręba, m. | 7361 | 2762 | 2761 | 2657 | 37.52 |  |
| 241608 | Szczekociny, gm. | 6955 | 2661 | 2658 | 2538 | 38.26 |  |
| 241609 | Włodowice, gm. | 4262 | 1194 | 1193 | 1127 | 28.02 |  |
| 241602 | Zawiercie, m. | 44933 | 16803 | 16793 | 16179 | 37.40 |  |
| 241610 | Żarnowiec, gm. | 3984 | 1949 | 1948 | 1865 | 48.92 |  |
| |
zawierciański, pow. |
103457 |
38017 |
37991 |
36414 |
36.75 |
 |
|
| |
| . |
. |
Turnout by location of ward electoral commission |
. |
. |
| . |
. |
| . |
. |
. |
. |
. |
. |
. |
. |
. |
. |
. |
. |
| No. |
Name |
No. entitled
to vote |
No. of ballot
papers issued |
No. of |
No. of ballot papers issued / No. entitled to vote
[%] |
| total votes |
valid votes |
| 1 | City | 69026 | 25930 | 25913 | 24942 | 37.57 |  |
| 2 | Country | 34431 | 12087 | 12078 | 11472 | 35.10 |  |
| . |
Turnout by number of inhabitants of commune |
. |
| 1 | to 5 000 | 2330 | 723 | 722 | 662 | 31.03 |  |
| 2 | from 5 001 to 10 000 | 42867 | 16065 | 16055 | 15374 | 37.48 |  |
| 3 | from 10 001 to 20 000 | 13327 | 4426 | 4421 | 4199 | 33.21 |  |
| 4 | from 20 001 to 50 000 | 0 | 0 | 0 | 0 | 0.00 | |
| 5 | from 50 001 to 100 000 | 44933 | 16803 | 16793 | 16179 | 37.40 |  |
| 6 | from 100 001 to 200 000 | 0 | 0 | 0 | 0 | 0.00 | |
| 7 | from 200 001 to 500 000 | 0 | 0 | 0 | 0 | 0.00 | |
| 8 | over 500 000 | 0 | 0 | 0 | 0 | 0.00 | |
|
|


 Legal Acts
 Documents
 Electoral Bodies
 Election Committees
 Turnout
 Results
 Statistical Data
 SENATE
 PRESIDENT
 Created by


 Legal Acts
 Documents
 Electoral Bodies
 Election Committees
 Turnout
 Results
 Statistical Data
 SENATE
 PRESIDENT
 Created by


