.
.
Legal Acts
Documents
Electoral Bodies
Election Committees
Turnout
Results
Statistical Data
SENATE
PRESIDENT
Created by
.
.
Voting Results
.
.
.
Voting Results for Committee
.
.
.
.
.
.
.
.
.
.
.
.
.
.
.
.
.
.
.
.
Polska
/
Gdynia
/
pucki, pow.
...
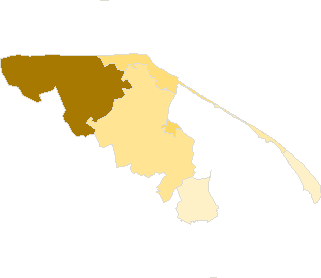
Komitet Wyborczy Platforma Obywatelska RP
List's Number:
8
No. of valid votes:
23617
No. of votes per List:
10041
42.52%
lack
36.20%
38.03%
39.86%
41.69%
43.52%
45.35%
47.18%
49.01%
50.84%
52.67%
not
.
.
.
.
.
.
.
.
.
.
.
.
of data
38.02%
39.85%
41.68%
43.51%
45.34%
47.17%
49.00%
50.83%
52.66%
54.50%
applicable
See also:
Turnout
Votes per Lists
Votes per Candidates
Information about Election Committee
Election results
Voting Results by location of ward electoral commission
.
.
Voting Results for Committee.
.
.
.
.
.
.
.
.
.
.
.
.
.
.
.
.
.
No.
Name
No. of entitled
to vote
No. of ballot papers
issued
No. of votes
No. of votes: per list / valid [%]
total
valid
per List
221101
Hel, m.
3471
1286
1286
1207
437
36.21
221102
Jastarnia, m.
3310
1635
1634
1587
612
38.56
221105
Kosakowo, gm.
5872
2764
2761
2695
987
36.62
221106
Krokowa, gm.
7346
3402
3402
3234
1762
54.48
221107
Puck, gm.
15379
6223
6223
6012
2445
40.67
221103
Puck, m.
9203
4065
4060
3888
1696
43.62
221104
Władysławowo, m.
11543
5123
5122
4994
2102
42.09
pucki, pow.
56124
24498
24488
23617
10041
42.52
.
.
Voting Results for Candidates
.
.
.
.
.
.
.
.
.
.
.
.
.
.
.
No.
Surname Names
No. of votes
% No. of votes per candidate/No. per list
% No. of votes per candidate/No. of valid votes
1
BIERNACKI Marek
2262
22.52
9.58
2
AZIEWICZ Tadeusz
240
2.39
1.02
3
KLEINA Kazimierz Mariusz
202
2.01
0.86
4
PLOCKE Kazimierz Florian
5967
59.42
25.27
5
BUDNIK Jerzy Feliks
417
4.15
1.77
6
KUMIK Ewa Barbara
87
0.86
0.37
7
ZABOROWSKI Roman
57
0.56
0.24
8
CYRZAN Grzegorz Piotr
25
0.24
0.11
9
STRZYŻEWICZ Ryszard Andrzej
23
0.22
0.10
10
LAMCZYK Stanisław Józef
21
0.20
0.09
11
JUCHNIEWICZ Katarzyna Jadwiga
43
0.42
0.18
12
SZCZEPAŃSKI Marek
50
0.49
0.21
13
KUBALEWSKI Arkadiusz Piotr
23
0.22
0.10
14
MIOTK Zyta Maria
142
1.41
0.60
15
KONWIŃSKI Zbigniew Marek
14
0.13
0.06
16
BAGNECKI Jacek Piotr
16
0.15
0.07
17
CZARNOWSKI Marek
24
0.23
0.10
18
ZIELIŃSKA Joanna Violetta
163
1.62
0.69
19
MODRZEJEWSKI Józef
24
0.23
0.10
20
LISOWSKA Bożenna
43
0.42
0.18
21
GEMBAL Robert Andrzej
8
0.07
0.03
22
MAZUR Henryka Anna
30
0.29
0.13
23
ZALAS Krystian Tomasz
5
0.04
0.02
24
RADZIMIŃSKI Szymon Marian
14
0.13
0.06
25
MARZEC Ireneusz Wiesław
17
0.16
0.07
26
MARCZAK Marcin
30
0.29
0.13
27
CHROŚCICKA Anna Maria
40
0.39
0.17
28
MŁYŃSKI Piotr Jerzy
54
0.53
0.23
Σ
10041
100.00
42.51
.
.
Voting Results by location of ward electoral commission.
.
.
.
.
.
.
.
.
.
.
.
.
.
.
.
.
.
No.
Name
No. of entitled
to vote
No. of ballot
papers issued
No. of votes
No. of votes: per list / valid [%]
total
valid
per List
1
City
27527
12109
12102
11676
4847
41.51
2
Country
28597
12389
12386
11941
5194
43.50
.
Voting Results by number of inhabitants of commune
.
1
to 5 000
6781
2921
2920
2794
1049
37.54
2
from 5 001 to 10 000
5872
2764
2761
2695
987
36.62
3
from 10 001 to 20 000
28092
12590
12584
12116
5560
45.89
4
from 20 001 to 50 000
15379
6223
6223
6012
2445
40.67
5
from 50 001 to 100 000
0
0
0
0
0
0.00
6
from 100 001 to 200 000
0
0
0
0
0
0.00
7
from 200 001 to 500 000
0
0
0
0
0
0.00
8
over 500 000
0
0
0
0
0
0.00
Legal Acts
Documents
Electoral Bodies
Election Committees
Turnout
Results
Statistical Data
SENATE
PRESIDENT
Created by
Copyright [c] 2005
Mikrobit Sp. z o.o.
. All Rights Reserved.
top