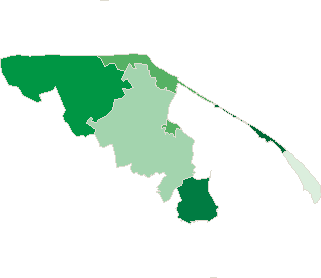
| . |
. |
Turnout in Election to the Sejm |
. |
. |
| . |
. |
| . |
. |
. |
. |
. |
. |
. |
. |
. |
. |
. |
. |
. |
. |
. |
. |
| Polska / Gdynia / pucki, pow. ... |
 |
| pucki, pow. |
| Statistics on 30.06.2005 |
| Population: |
73982 |
| Area: |
575.07 km2 |
| Population density: |
128 os/km2 |
| Summary voting results |
| No. of polling wards: |
47 |
No. of polling wards which
transmitted the results: |
47 |
| No. of people entitled to vote: |
56124 |
| No. of ballot papers issued: |
24498 |
43.65% |
|
| lack | 37.04% | 38.28% | 39.52% | 40.76% | 42.00% | 43.24% | 44.48% | 45.72% | 46.96% | 48.20% | | | . | . | . | . | . | . | . | . | . | . | . | . | | of data | 38.27% | 39.51% | 40.75% | 41.99% | 43.23% | 44.47% | 45.71% | 46.95% | 48.19% | 49.44% | |
|
See also:
|
| . |
. |
Voting results |
. |
. |
| . |
. |
| . |
. |
. |
. |
. |
. |
. |
. |
. |
. |
. |
. |
| No. |
Name |
No. entitled
to vote |
No. of ballot
papers issued |
No. of |
No. of ballot papers issued / No. entitled to vote
[%] |
| total votes |
valid votes |
| 221101 | Hel, m. | 3471 | 1286 | 1286 | 1207 | 37.05 |  |
| 221102 | Jastarnia, m. | 3310 | 1635 | 1634 | 1587 | 49.40 |  |
| 221105 | Kosakowo, gm. | 5872 | 2764 | 2761 | 2695 | 47.07 |  |
| 221106 | Krokowa, gm. | 7346 | 3402 | 3402 | 3234 | 46.31 |  |
| 221107 | Puck, gm. | 15379 | 6223 | 6223 | 6012 | 40.46 |  |
| 221103 | Puck, m. | 9203 | 4065 | 4060 | 3888 | 44.17 |  |
| 221104 | Władysławowo, m. | 11543 | 5123 | 5122 | 4994 | 44.38 |  |
| |
pucki, pow. |
56124 |
24498 |
24488 |
23617 |
43.65 |
 |
|
| |
| . |
. |
Turnout by location of ward electoral commission |
. |
. |
| . |
. |
| . |
. |
. |
. |
. |
. |
. |
. |
. |
. |
. |
. |
| No. |
Name |
No. entitled
to vote |
No. of ballot
papers issued |
No. of |
No. of ballot papers issued / No. entitled to vote
[%] |
| total votes |
valid votes |
| 1 | City | 27527 | 12109 | 12102 | 11676 | 43.99 |  |
| 2 | Country | 28597 | 12389 | 12386 | 11941 | 43.32 |  |
| . |
Turnout by number of inhabitants of commune |
. |
| 1 | to 5 000 | 6781 | 2921 | 2920 | 2794 | 43.08 |  |
| 2 | from 5 001 to 10 000 | 5872 | 2764 | 2761 | 2695 | 47.07 |  |
| 3 | from 10 001 to 20 000 | 28092 | 12590 | 12584 | 12116 | 44.82 |  |
| 4 | from 20 001 to 50 000 | 15379 | 6223 | 6223 | 6012 | 40.46 |  |
| 5 | from 50 001 to 100 000 | 0 | 0 | 0 | 0 | 0.00 | |
| 6 | from 100 001 to 200 000 | 0 | 0 | 0 | 0 | 0.00 | |
| 7 | from 200 001 to 500 000 | 0 | 0 | 0 | 0 | 0.00 | |
| 8 | over 500 000 | 0 | 0 | 0 | 0 | 0.00 | |
|
|


 Legal Acts
 Documents
 Electoral Bodies
 Election Committees
 Turnout
 Results
 Statistical Data
 SENATE
 PRESIDENT
 Created by


 Legal Acts
 Documents
 Electoral Bodies
 Election Committees
 Turnout
 Results
 Statistical Data
 SENATE
 PRESIDENT
 Created by


