.
.
Legal Acts
Documents
Electoral Bodies
Election Committees
Turnout
Results
Statistical Data
SENATE
PRESIDENT
Created by
.
.
Voting Results
.
.
.
Voting Results for Committee
.
.
.
.
.
.
.
.
.
.
.
.
.
.
.
.
.
.
.
.
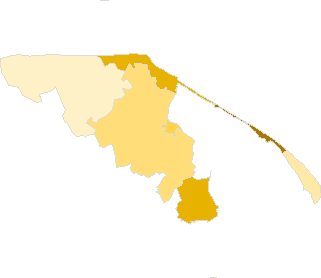
Polska
/
Gdynia
/
pucki, pow.
...
Komitet Wyborczy Prawo i Sprawiedliwość
List's Number:
6
No. of valid votes:
23617
No. of votes per List:
6564
27.79%
lack
19.23%
20.94%
22.65%
24.36%
26.07%
27.78%
29.49%
31.20%
32.91%
34.62%
not
.
.
.
.
.
.
.
.
.
.
.
.
of data
20.93%
22.64%
24.35%
26.06%
27.77%
29.48%
31.19%
32.90%
34.61%
36.33%
applicable
See also:
Turnout
Votes per Lists
Votes per Candidates
Information about Election Committee
Election results
Voting Results by location of ward electoral commission
.
.
Voting Results for Committee.
.
.
.
.
.
.
.
.
.
.
.
.
.
.
.
.
.
No.
Name
No. of entitled
to vote
No. of ballot papers
issued
No. of votes
No. of votes: per list / valid [%]
total
valid
per List
221101
Hel, m.
3471
1286
1286
1207
266
22.04
221102
Jastarnia, m.
3310
1635
1634
1587
576
36.29
221105
Kosakowo, gm.
5872
2764
2761
2695
853
31.65
221106
Krokowa, gm.
7346
3402
3402
3234
622
19.23
221107
Puck, gm.
15379
6223
6223
6012
1531
25.47
221103
Puck, m.
9203
4065
4060
3888
1105
28.42
221104
Władysławowo, m.
11543
5123
5122
4994
1611
32.26
pucki, pow.
56124
24498
24488
23617
6564
27.79
.
.
Voting Results for Candidates
.
.
.
.
.
.
.
.
.
.
.
.
.
.
.
No.
Surname Names
No. of votes
% No. of votes per candidate/No. per list
% No. of votes per candidate/No. of valid votes
1
SZCZYPIŃSKA Jolanta Irena
607
9.24
2.57
2
SELLIN Jarosław Daniel
974
14.83
4.12
3
BONKOWSKI Waldemar
111
1.69
0.47
4
KOZAK Zbigniew Ryszard
148
2.25
0.63
5
STANKE Piotr Jerzy
66
1.00
0.28
6
MARKOWSKI Jacek Zygfryd
85
1.29
0.36
7
GASZTA Grzegorz Marek
29
0.44
0.12
8
BARTÓLEWSKA Iwona Barbara
55
0.83
0.23
9
PĘK Tadeusz Szymon
115
1.75
0.49
10
ANDERS Jadwiga
48
0.73
0.20
11
LEWENSTAM Wojciech Kazimierz
11
0.16
0.05
12
PLESZYNIAK Andrzej
10
0.15
0.04
13
WICZKOWSKI Janusz Piotr
26
0.39
0.11
14
KUŻOWNIK Jan
16
0.24
0.07
15
RECLAF Witold Grzegorz
137
2.08
0.58
16
KAŹMIERCZAK Andrzej Stanisław
35
0.53
0.15
17
TREDER Adam
46
0.70
0.19
18
KACZYŃSKI Ryszard Paweł
405
6.17
1.71
19
KRUSZYŃSKI Krzysztof Leon
20
0.30
0.08
20
ORZEŁ Zygmunt
3478
52.98
14.73
21
JANUSZEWSKI Zbigniew
14
0.21
0.06
22
GATZ Stanisława Wanda
11
0.16
0.05
23
PROCHOWSKI Dawid Jan
14
0.21
0.06
24
SZULIST Grażyna Irena
24
0.36
0.10
25
BARECKI Marek Andrzej
11
0.16
0.05
26
FURTAK Małgorzata Zofia
39
0.59
0.17
27
UŻAROWSKI Janusz Andrzej
1
0.01
0.00
28
ŁUCZYK Mariusz Wojciech
28
0.42
0.12
Σ
6564
100.00
27.79
.
.
Voting Results by location of ward electoral commission.
.
.
.
.
.
.
.
.
.
.
.
.
.
.
.
.
.
No.
Name
No. of entitled
to vote
No. of ballot
papers issued
No. of votes
No. of votes: per list / valid [%]
total
valid
per List
1
City
27527
12109
12102
11676
3558
30.47
2
Country
28597
12389
12386
11941
3006
25.17
.
Voting Results by number of inhabitants of commune
.
1
to 5 000
6781
2921
2920
2794
842
30.14
2
from 5 001 to 10 000
5872
2764
2761
2695
853
31.65
3
from 10 001 to 20 000
28092
12590
12584
12116
3338
27.55
4
from 20 001 to 50 000
15379
6223
6223
6012
1531
25.47
5
from 50 001 to 100 000
0
0
0
0
0
0.00
6
from 100 001 to 200 000
0
0
0
0
0
0.00
7
from 200 001 to 500 000
0
0
0
0
0
0.00
8
over 500 000
0
0
0
0
0
0.00
Legal Acts
Documents
Electoral Bodies
Election Committees
Turnout
Results
Statistical Data
SENATE
PRESIDENT
Created by
Copyright [c] 2005
Mikrobit Sp. z o.o.
. All Rights Reserved.
top