| . |
. |
Electoral Constituencies |
. |
. |
| . |
. |
| . |
. |
. |
. |
. |
. |
. |
. |
. |
. |
. |
. |
. |
. |
. |
. |
| Polska / Koszalin |
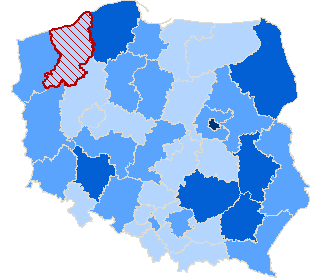 |
| Koszalin, okr. 40 |
| Statistical Data |
| Number of lists: |
12 |
| Number of candidates: |
167 |
| female: |
45 (26.95%) |
| male: |
122 (73.05%) |
| Number of seats: |
8 |
| Number of candidates/seat: |
20 |
| The average age of: |
43 |
| female: |
42 |
| male: |
44 |
| Youngest: |
21 |
| Oldest: |
75 |
|
| 7 |
11 |
14 |
17 |
| . |
. |
. |
. |
| 10 |
13 |
16 |
19 |
|
| . |
. |
The number of candidates in the age brackets |
. |
. |
| . |
. |
| . |
. |
. |
. |
. |
. |
. |
. |
. |
. |
. |
| age brackets |
Number of candidates |
total % |
female |
male |
| Number |
% |
Number |
% |
| 21 - 29 |
31 |
18.56 |
8 |
4.79 |
23 |
13.77 |
| 30 - 39 |
27 |
16.17 |
8 |
4.79 |
19 |
11.38 |
| 40 - 49 |
52 |
31.14 |
17 |
10.18 |
35 |
20.96 |
| 50 - 59 |
43 |
25.75 |
10 |
5.99 |
33 |
19.76 |
| 60 - 69 |
13 |
7.78 |
2 |
1.20 |
11 |
6.59 |
| 70 and over |
1 |
0.60 |
0 |
0.00 |
1 |
0.60 |
| total |
167 |
100.00 |
45 |
26.95 |
122 |
73.05 |
|
|


 Legal Acts
 Constituencies Electoral