.
.
Legal Acts
Documents
Electoral Bodies
Election Committees
Turnout
Results
Statistical Data
SENATE
PRESIDENT
Created by
.
.
Voting Results
.
.
.
Voting Results for Committee
.
.
.
.
.
.
.
.
.
.
.
.
.
.
.
.
.
.
.
.
Polska
/
Opole
/
brzeski, pow.
...
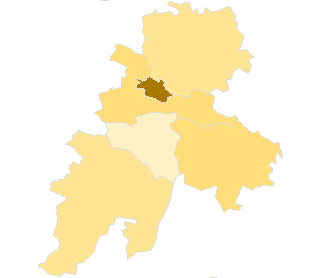
Komitet Wyborczy Socjaldemokracji Polskiej
List's Number:
5
No. of valid votes:
24953
No. of votes per List:
908
3.64%
lack
1.50%
1.85%
2.20%
2.55%
2.90%
3.25%
3.60%
3.95%
4.30%
4.65%
not
.
.
.
.
.
.
.
.
.
.
.
.
of data
1.84%
2.19%
2.54%
2.89%
3.24%
3.59%
3.94%
4.29%
4.64%
5.00%
applicable
See also:
Turnout
Votes per Lists
Votes per Candidates
Information about Election Committee
Election results
Voting Results by location of ward electoral commission
.
.
Voting Results for Committee.
.
.
.
.
.
.
.
.
.
.
.
.
.
.
.
.
.
No.
Name
No. of entitled
to vote
No. of ballot papers
issued
No. of votes
No. of votes: per list / valid [%]
total
valid
per List
160101
Brzeg, m.
31381
12007
11962
11620
579
4.98
160103
Grodków, gm.
15566
4953
4953
4772
114
2.39
160104
Lewin Brzeski, gm.
10377
3449
3448
3299
93
2.82
160105
Lubsza, gm.
6820
2235
2235
2142
52
2.43
160106
Olszanka, gm.
3845
1313
1313
1263
19
1.50
160102
Skarbimierz, gm.
5194
1941
1941
1857
51
2.75
brzeski, pow.
73183
25898
25852
24953
908
3.64
.
.
Voting Results for Candidates
.
.
.
.
.
.
.
.
.
.
.
.
.
.
.
No.
Surname Names
No. of votes
% No. of votes per candidate/No. per list
% No. of votes per candidate/No. of valid votes
1
KASZNIA Arkadiusz
264
29.07
1.06
2
WIECHEĆ Krzysztof Bohdan
27
2.97
0.11
3
SASKA Joanna Aleksandra
51
5.61
0.20
4
MACIASZEK Joanna Eleonora
272
29.95
1.09
5
JACENTY Tomasz Artur
23
2.53
0.09
6
ŚWIATŁOWSKI Andrzej Stanisław
16
1.76
0.06
7
KRUPKA Stanisław Walenty
15
1.65
0.06
8
KULPA Ryszard Jerzy
19
2.09
0.08
9
KOWALCZYK Małgorzata Anna
19
2.09
0.08
10
GODZWON Mieczysław
3
0.33
0.01
11
KOWALCZYK Zbigniew
27
2.97
0.11
12
DEC Bogusław Łukasz
19
2.09
0.08
13
KOZŁOWSKI Tomasz Kazimierz
18
1.98
0.07
14
ZARANKIEWICZ Marian Adam
7
0.77
0.03
15
MAZUREK Dariusz
28
3.08
0.11
16
KROPACZ Józef
7
0.77
0.03
17
GORZĄCH Maria
2
0.22
0.01
18
GRACZYK Jan Bronisław
8
0.88
0.03
19
KUŁAKOWSKI Dariusz
7
0.77
0.03
20
NAPIERAJ Stanisław
8
0.88
0.03
21
HUDZIK Grzegorz
9
0.99
0.04
22
GRYGIEL Zdzisław Witold
4
0.44
0.02
23
KONDRATOWICZ Piotr Tadeusz
8
0.88
0.03
24
STAROWICZ Tadeusz Jan
7
0.77
0.03
25
TELĘGA Bożena
11
1.21
0.04
26
OGONOWSKI Krzysztof
29
3.19
0.12
Σ
908
100.00
3.63
.
.
Voting Results by location of ward electoral commission.
.
.
.
.
.
.
.
.
.
.
.
.
.
.
.
.
.
No.
Name
No. of entitled
to vote
No. of ballot
papers issued
No. of votes
No. of votes: per list / valid [%]
total
valid
per List
1
City
44775
16778
16733
16217
707
4.36
2
Country
28408
9120
9119
8736
201
2.30
.
Voting Results by number of inhabitants of commune
.
1
to 5 000
3845
1313
1313
1263
19
1.50
2
from 5 001 to 10 000
12014
4176
4176
3999
103
2.58
3
from 10 001 to 20 000
25943
8402
8401
8071
207
2.56
4
from 20 001 to 50 000
31381
12007
11962
11620
579
4.98
5
from 50 001 to 100 000
0
0
0
0
0
0.00
6
from 100 001 to 200 000
0
0
0
0
0
0.00
7
from 200 001 to 500 000
0
0
0
0
0
0.00
8
over 500 000
0
0
0
0
0
0.00
Legal Acts
Documents
Electoral Bodies
Election Committees
Turnout
Results
Statistical Data
SENATE
PRESIDENT
Created by
Copyright [c] 2005
Mikrobit Sp. z o.o.
. All Rights Reserved.
top