.
.
Legal Acts
Documents
Electoral Bodies
Election Committees
Turnout
Results
Statistical Data
SENATE
PRESIDENT
Created by
.
.
Voting Results
.
.
.
Voting Results for Committee
.
.
.
.
.
.
.
.
.
.
.
.
.
.
.
.
.
.
.
.
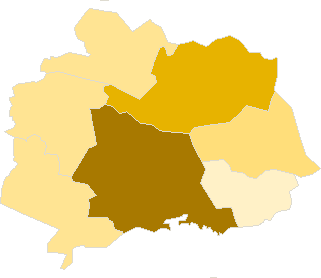
Polska
/
Kraków
/
miechowski, pow.
...
Komitet Wyborczy Socjaldemokracji Polskiej
List's Number:
5
No. of valid votes:
13951
No. of votes per List:
326
2.34%
lack
0.85%
1.10%
1.35%
1.60%
1.85%
2.10%
2.35%
2.60%
2.85%
3.10%
not
.
.
.
.
.
.
.
.
.
.
.
.
of data
1.09%
1.34%
1.59%
1.84%
2.09%
2.34%
2.59%
2.84%
3.09%
3.35%
applicable
See also:
Turnout
Votes per Lists
Votes per Candidates
Information about Election Committee
Election results
Voting Results by location of ward electoral commission
.
.
Voting Results for Committee.
.
.
.
.
.
.
.
.
.
.
.
.
.
.
.
.
.
No.
Name
No. of entitled
to vote
No. of ballot papers
issued
No. of votes
No. of votes: per list / valid [%]
total
valid
per List
120801
Charsznica, gm.
6348
2377
2376
2310
35
1.52
120802
Gołcza, gm.
5050
1870
1870
1758
26
1.48
120803
Kozłów, gm.
4040
1226
1222
1196
17
1.42
120804
Książ Wielki, gm.
4495
1573
1573
1507
42
2.79
120805
Miechów, gm.
16295
5759
5746
5541
183
3.30
120806
Racławice, gm.
2045
609
609
585
5
0.85
120807
Słaboszów, gm.
3221
1112
1112
1054
18
1.71
miechowski, pow.
41494
14526
14508
13951
326
2.34
.
.
Voting Results for Candidates
.
.
.
.
.
.
.
.
.
.
.
.
.
.
.
No.
Surname Names
No. of votes
% No. of votes per candidate/No. per list
% No. of votes per candidate/No. of valid votes
1
WILKOSZ-ŚLIWA Małgorzata
150
46.01
1.08
2
ORKISZ Jan
104
31.90
0.75
3
RUGGIERO Janusz Ferdynand
4
1.22
0.03
4
ROSIŃSKA Katarzyna Maria
6
1.84
0.04
5
PIETRZYK Sławomir Jan
6
1.84
0.04
6
JACHYM Marcin Jacek
0
0.00
0.00
7
LACH Zbigniew
3
0.92
0.02
8
CICHOSZ Adam
4
1.22
0.03
9
WŁODEK Magdalena Maria
8
2.45
0.06
10
JANIK Andrzej Jacek
5
1.53
0.04
11
BOGDANOWICZ Marek
4
1.22
0.03
12
ŁUKASZEWSKI Jacek
3
0.92
0.02
13
BRZEZIŃSKI Piotr Andrzej
1
0.30
0.01
14
UDZIELA Wiesława Danuta
5
1.53
0.04
15
TRYJAŃSKI Bogumił Stefan
1
0.30
0.01
16
SAGAN Wojciech Piotr
2
0.61
0.01
17
MĄCZYŃSKI Zbigniew Jerzy
1
0.30
0.01
18
WITEK Bartłomiej
0
0.00
0.00
19
BAJOR Piotr Grzegorz
2
0.61
0.01
20
KOREPTA Zbigniew Wiesław
3
0.92
0.02
21
KRACZKA Paweł
0
0.00
0.00
22
MALAK Małgorzata
2
0.61
0.01
23
MAŁYSIAK Ewa Teresa
4
1.22
0.03
24
CZARNECKA Aleksandra
4
1.22
0.03
25
GAWLIK Wiesław
0
0.00
0.00
26
BASIAK Grzegorz Łukasz
4
1.22
0.03
Σ
326
100.00
2.33
.
.
Voting Results by location of ward electoral commission.
.
.
.
.
.
.
.
.
.
.
.
.
.
.
.
.
.
No.
Name
No. of entitled
to vote
No. of ballot
papers issued
No. of votes
No. of votes: per list / valid [%]
total
valid
per List
1
City
9852
3977
3965
3821
171
4.48
2
Country
31642
10549
10543
10130
155
1.53
.
Voting Results by number of inhabitants of commune
.
1
to 5 000
5266
1721
1721
1639
23
1.40
2
from 5 001 to 10 000
19933
7046
7041
6771
120
1.77
3
from 10 001 to 20 000
0
0
0
0
0
0.00
4
from 20 001 to 50 000
16295
5759
5746
5541
183
3.30
5
from 50 001 to 100 000
0
0
0
0
0
0.00
6
from 100 001 to 200 000
0
0
0
0
0
0.00
7
from 200 001 to 500 000
0
0
0
0
0
0.00
8
over 500 000
0
0
0
0
0
0.00
Legal Acts
Documents
Electoral Bodies
Election Committees
Turnout
Results
Statistical Data
SENATE
PRESIDENT
Created by
Copyright [c] 2005
Mikrobit Sp. z o.o.
. All Rights Reserved.
top