| . |
. |
Voting Results for Committee |
. |
. |
| . |
. |
| . |
. |
. |
. |
. |
. |
. |
. |
. |
. |
. |
. |
. |
. |
. |
. |
| Polska / Zielona Góra / żarski, pow. ... |
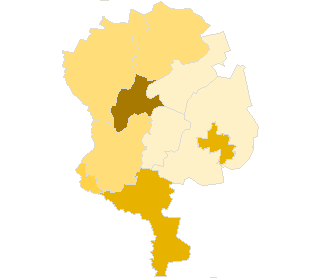 |
| Komitet Wyborczy Socjaldemokracji Polskiej |
| List's Number: |
5 |
| No. of valid votes: |
23906 |
| No. of votes per List: |
745 |
3.12% |
|
| lack | 1.82% | 2.08% | 2.34% | 2.60% | 2.86% | 3.12% | 3.38% | 3.64% | 3.90% | 4.16% | not | | . | . | . | . | . | . | . | . | . | . | . | . | | of data | 2.07% | 2.33% | 2.59% | 2.85% | 3.11% | 3.37% | 3.63% | 3.89% | 4.15% | 4.42% | applicable |
|
See also:
|
| . |
. |
Voting Results for Committee. |
. |
. |
| . |
. |
| . |
. |
. |
. |
. |
. |
. |
. |
. |
. |
. |
. |
. |
| No. |
Name |
No. of entitled
to vote |
No. of ballot papers
issued |
No. of votes |
No. of votes: per list / valid [%] |
| total |
valid |
per List |
| 081103 | Brody, gm. | 2754 | 769 | 769 | 726 | 20 | 2.75 |  |
| 081104 | Jasień, gm. | 5780 | 1581 | 1580 | 1479 | 27 | 1.83 | |
| 081105 | Lipinki Łużyckie, gm. | 2521 | 704 | 703 | 674 | 14 | 2.08 | |
| 081106 | Lubsko, gm. | 15802 | 4781 | 4779 | 4589 | 131 | 2.85 | |
| 081101 | Łęknica, m. | 2003 | 527 | 527 | 492 | 16 | 3.25 | |
| 081107 | Przewóz, gm. | 2494 | 684 | 684 | 638 | 24 | 3.76 | |
| 081108 | Trzebiel, gm. | 4573 | 1275 | 1274 | 1146 | 30 | 2.62 | |
| 081109 | Tuplice, gm. | 2589 | 702 | 701 | 634 | 28 | 4.42 | |
| 081110 | Żary, gm. | 8822 | 2522 | 2519 | 2424 | 50 | 2.06 | |
| 081102 | Żary, m. | 31862 | 11486 | 11481 | 11104 | 405 | 3.65 | |
| |
żarski, pow. |
79200 |
25031 |
25017 |
23906 |
745 |
3.12 |
 |
|
| |
| . |
. |
Voting Results by location of ward electoral commission. |
. |
. |
| . |
. |
| . |
. |
. |
. |
. |
. |
. |
. |
. |
. |
. |
. |
. |
| No. |
Name |
No. of entitled
to vote |
No. of ballot
papers issued |
No. of votes |
No. of votes: per list / valid [%] |
| total |
valid |
per List |
| 1 | City | 50227 | 17085 | 17077 | 16453 | 556 | 3.38 | |
| 2 | Country | 28973 | 7946 | 7940 | 7453 | 189 | 2.54 | |
| . |
Voting Results by number of inhabitants of commune |
. |
| 1 | to 5 000 | 12361 | 3386 | 3384 | 3164 | 102 | 3.22 | |
| 2 | from 5 001 to 10 000 | 10353 | 2856 | 2854 | 2625 | 57 | 2.17 | |
| 3 | from 10 001 to 20 000 | 8822 | 2522 | 2519 | 2424 | 50 | 2.06 | |
| 4 | from 20 001 to 50 000 | 47664 | 16267 | 16260 | 15693 | 536 | 3.42 | |
| 5 | from 50 001 to 100 000 | 0 | 0 | 0 | 0 | 0 | 0.00 | |
| 6 | from 100 001 to 200 000 | 0 | 0 | 0 | 0 | 0 | 0.00 | |
| 7 | from 200 001 to 500 000 | 0 | 0 | 0 | 0 | 0 | 0.00 | |
| 8 | over 500 000 | 0 | 0 | 0 | 0 | 0 | 0.00 | |
|
|


 Legal Acts
 Legal Acts