| . |
. |
Voting Results for Committee |
. |
. |
| . |
. |
| . |
. |
. |
. |
. |
. |
. |
. |
. |
. |
. |
. |
. |
. |
. |
. |
| Polska / Radom / radomski, pow. ... |
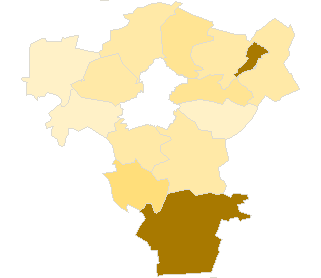 |
| Komitet Wyborczy Sojusz Lewicy Demokratycznej |
| List's Number: |
7 |
| No. of valid votes: |
38990 |
| No. of votes per List: |
2646 |
6.79% |
|
| lack | 2.37% | 3.57% | 4.77% | 5.97% | 7.17% | 8.37% | 9.57% | 10.77% | 11.97% | 13.17% | not | | . | . | . | . | . | . | . | . | . | . | . | . | | of data | 3.56% | 4.76% | 5.96% | 7.16% | 8.36% | 9.56% | 10.76% | 11.96% | 13.16% | 14.37% | applicable |
|
See also:
|
| . |
. |
Voting Results for Committee. |
. |
. |
| . |
. |
| . |
. |
. |
. |
. |
. |
. |
. |
. |
. |
. |
. |
. |
| No. |
Name |
No. of entitled
to vote |
No. of ballot papers
issued |
No. of votes |
No. of votes: per list / valid [%] |
| total |
valid |
per List |
| 142502 | Gózd, gm. | 5682 | 2051 | 2045 | 1994 | 50 | 2.51 |  |
| 142503 | Iłża, gm. | 12786 | 4287 | 4281 | 4096 | 585 | 14.28 | |
| 142504 | Jastrzębia, gm. | 4814 | 1801 | 1796 | 1713 | 89 | 5.20 | |
| 142505 | Jedlińsk, gm. | 9671 | 3559 | 3558 | 3395 | 138 | 4.06 | |
| 142506 | Jedlnia-Letnisko, gm. | 8650 | 3563 | 3555 | 3396 | 171 | 5.04 | |
| 142507 | Kowala, gm. | 7615 | 2764 | 2758 | 2657 | 110 | 4.14 | |
| 142508 | Pionki, gm. | 7631 | 2233 | 2233 | 2115 | 95 | 4.49 | |
| 142501 | Pionki, m. | 16913 | 6556 | 6525 | 6345 | 881 | 13.88 | |
| 142509 | Przytyk, gm. | 5218 | 1971 | 1971 | 1893 | 45 | 2.38 | |
| 142510 | Skaryszew, gm. | 9811 | 3830 | 3827 | 3669 | 133 | 3.62 | |
| 142511 | Wierzbica, gm. | 7928 | 2440 | 2440 | 2313 | 165 | 7.13 | |
| 142512 | Wolanów, gm. | 5979 | 2461 | 2454 | 2371 | 69 | 2.91 | |
| 142513 | Zakrzew, gm. | 8038 | 3167 | 3165 | 3033 | 115 | 3.79 | |
| |
radomski, pow. |
110736 |
40683 |
40608 |
38990 |
2646 |
6.79 |
 |
|
| |
| . |
. |
Voting Results by location of ward electoral commission. |
. |
. |
| . |
. |
| . |
. |
. |
. |
. |
. |
. |
. |
. |
. |
. |
. |
. |
| No. |
Name |
No. of entitled
to vote |
No. of ballot
papers issued |
No. of votes |
No. of votes: per list / valid [%] |
| total |
valid |
per List |
| 1 | City | 24899 | 9697 | 9659 | 9365 | 1282 | 13.69 | |
| 2 | Country | 85837 | 30986 | 30949 | 29625 | 1364 | 4.60 | |
| . |
Voting Results by number of inhabitants of commune |
. |
| 1 | to 5 000 | 0 | 0 | 0 | 0 | 0 | 0.00 | |
| 2 | from 5 001 to 10 000 | 21693 | 8284 | 8266 | 7971 | 253 | 3.17 | |
| 3 | from 10 001 to 20 000 | 72130 | 25843 | 25817 | 24674 | 1512 | 6.13 | |
| 4 | from 20 001 to 50 000 | 16913 | 6556 | 6525 | 6345 | 881 | 13.88 | |
| 5 | from 50 001 to 100 000 | 0 | 0 | 0 | 0 | 0 | 0.00 | |
| 6 | from 100 001 to 200 000 | 0 | 0 | 0 | 0 | 0 | 0.00 | |
| 7 | from 200 001 to 500 000 | 0 | 0 | 0 | 0 | 0 | 0.00 | |
| 8 | over 500 000 | 0 | 0 | 0 | 0 | 0 | 0.00 | |
|
|


 Legal Acts
 Legal Acts