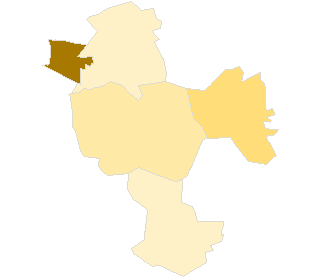
.
.
Legal Acts
Documents
Electoral Bodies
Election Committees
Turnout
Results
Statistical Data
SENATE
PRESIDENT
Created by
.
.
Voting Results
.
.
.
Voting Results for Committee
.
.
.
.
.
.
.
.
.
.
.
.
.
.
.
.
.
.
.
.
Polska
/
Lublin
/
świdnicki, pow.
...
Komitet Wyborczy Sojusz Lewicy Demokratycznej
List's Number:
7
No. of valid votes:
22024
No. of votes per List:
1615
7.33%
lack
3.16%
3.77%
4.38%
4.99%
5.60%
6.21%
6.82%
7.43%
8.04%
8.65%
not
.
.
.
.
.
.
.
.
.
.
.
.
of data
3.76%
4.37%
4.98%
5.59%
6.20%
6.81%
7.42%
8.03%
8.64%
9.26%
applicable
See also:
Turnout
Votes per Lists
Votes per Candidates
Information about Election Committee
Election results
Voting Results by location of ward electoral commission
.
.
Voting Results for Committee.
.
.
.
.
.
.
.
.
.
.
.
.
.
.
.
.
.
No.
Name
No. of entitled
to vote
No. of ballot papers
issued
No. of votes
No. of votes: per list / valid [%]
total
valid
per List
061702
Mełgiew, gm.
6186
2251
2251
2179
69
3.17
061703
Piaski, gm.
8513
2769
2768
2684
104
3.87
061704
Rybczewice, gm.
3281
1247
1247
1162
43
3.70
061701
Świdnik, m.
33209
14431
14415
14053
1295
9.22
061705
Trawniki, gm.
7264
2074
2074
1946
104
5.34
świdnicki, pow.
58453
22772
22755
22024
1615
7.33
.
.
Voting Results for Candidates
.
.
.
.
.
.
.
.
.
.
.
.
.
.
.
No.
Surname Names
No. of votes
% No. of votes per candidate/No. per list
% No. of votes per candidate/No. of valid votes
1
KOWALCZYK Stanisław
480
29.72
2.18
2
KURCZUK Grzegorz
562
34.79
2.55
3
STASIAK Celina Waleria
83
5.13
0.38
4
OSIK Wiktor Jerzy
5
0.30
0.02
5
SIEMBIDA Marianna
9
0.55
0.04
6
GALANT Henryk Józef
10
0.61
0.05
7
GAWINOWSKI Jacek
5
0.30
0.02
8
KUSIAK Zygmunt Edward
21
1.30
0.10
9
GRUDZIŃSKI Robert
8
0.49
0.04
10
KRAKOWIAK Leszek Jan
216
13.37
0.98
11
KRASUCKI Wacław Jan
3
0.18
0.01
12
LIPNICKA Anna Elżbieta
19
1.17
0.09
13
MAJEWSKI Jan Wincenty
6
0.37
0.03
14
MALEC Adam
74
4.58
0.34
15
GAGOŚ Robert Wojciech
3
0.18
0.01
16
GLINKA Tomasz Ryszard
3
0.18
0.01
17
DMOWSKA-PUKACZ Alicja Joanna
9
0.55
0.04
18
CIERPIATKA Krzysztof Jan
2
0.12
0.01
19
FILIPEK Kazimierz
5
0.30
0.02
20
ŚCISEŁ Jan Stanisław
1
0.06
0.00
21
BARTUZI Henryk
1
0.06
0.00
22
SZAREK Andrzej Wiktor
2
0.12
0.01
23
BEREJ Elżbieta
5
0.30
0.02
24
ROGOTOWICZ Dariusz Jacek
5
0.30
0.02
25
SZEWCZYK Paweł Kamil
34
2.10
0.15
26
MACIĄG Dariusz Sławomir
6
0.37
0.03
27
SZPAKOWSKA Marianna
6
0.37
0.03
28
DUDZIŃSKA Elżbieta Jadwiga
10
0.61
0.05
29
ZYCHOWICZ Andrzej
3
0.18
0.01
30
DOMŻAŁ-DRZEWICKA Renata Anna
19
1.17
0.09
Σ
1615
100.00
7.33
.
.
Voting Results by location of ward electoral commission.
.
.
.
.
.
.
.
.
.
.
.
.
.
.
.
.
.
No.
Name
No. of entitled
to vote
No. of ballot
papers issued
No. of votes
No. of votes: per list / valid [%]
total
valid
per List
1
City
35349
15279
15263
14867
1349
9.07
2
Country
23104
7493
7492
7157
266
3.72
.
Voting Results by number of inhabitants of commune
.
1
to 5 000
3281
1247
1247
1162
43
3.70
2
from 5 001 to 10 000
13450
4325
4325
4125
173
4.19
3
from 10 001 to 20 000
8513
2769
2768
2684
104
3.87
4
from 20 001 to 50 000
33209
14431
14415
14053
1295
9.22
5
from 50 001 to 100 000
0
0
0
0
0
0.00
6
from 100 001 to 200 000
0
0
0
0
0
0.00
7
from 200 001 to 500 000
0
0
0
0
0
0.00
8
over 500 000
0
0
0
0
0
0.00
Legal Acts
Documents
Electoral Bodies
Election Committees
Turnout
Results
Statistical Data
SENATE
PRESIDENT
Created by
Copyright [c] 2005
Mikrobit Sp. z o.o.
. All Rights Reserved.
top