.
.
Legal Acts
Documents
Electoral Bodies
Election Committees
Turnout
Results
Statistical Data
SENATE
PRESIDENT
Created by
.
.
Voting Results
.
.
.
Voting Results for Committee
.
.
.
.
.
.
.
.
.
.
.
.
.
.
.
.
.
.
.
.
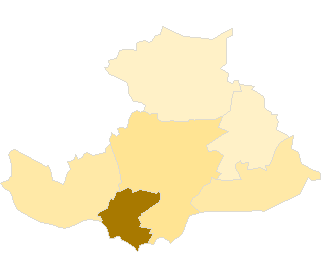
Polska
/
Lublin
/
rycki, pow.
...
Komitet Wyborczy Sojusz Lewicy Demokratycznej
List's Number:
7
No. of valid votes:
18899
No. of votes per List:
1929
10.21%
lack
3.98%
5.53%
7.08%
8.63%
10.18%
11.73%
13.28%
14.83%
16.38%
17.93%
not
.
.
.
.
.
.
.
.
.
.
.
.
of data
5.52%
7.07%
8.62%
10.17%
11.72%
13.27%
14.82%
16.37%
17.92%
19.48%
applicable
See also:
Turnout
Votes per Lists
Votes per Candidates
Information about Election Committee
Election results
Voting Results by location of ward electoral commission
.
.
Voting Results for Committee.
.
.
.
.
.
.
.
.
.
.
.
.
.
.
.
.
.
No.
Name
No. of entitled
to vote
No. of ballot papers
issued
No. of votes
No. of votes: per list / valid [%]
total
valid
per List
061601
Dęblin, m.
14867
5915
5901
5656
1098
19.41
061602
Kłoczew, gm.
5850
2411
2410
2285
91
3.98
061603
Nowodwór, gm.
3291
1381
1381
1313
62
4.72
061604
Ryki, gm.
16785
7009
7005
6689
483
7.22
061605
Stężyca, gm.
4472
1868
1863
1757
111
6.32
061606
Ułęż, gm.
2902
1274
1273
1199
84
7.01
rycki, pow.
48167
19858
19833
18899
1929
10.21
.
.
Voting Results for Candidates
.
.
.
.
.
.
.
.
.
.
.
.
.
.
.
No.
Surname Names
No. of votes
% No. of votes per candidate/No. per list
% No. of votes per candidate/No. of valid votes
1
KOWALCZYK Stanisław
313
16.22
1.66
2
KURCZUK Grzegorz
448
23.22
2.37
3
STASIAK Celina Waleria
49
2.54
0.26
4
OSIK Wiktor Jerzy
15
0.77
0.08
5
SIEMBIDA Marianna
7
0.36
0.04
6
GALANT Henryk Józef
5
0.25
0.03
7
GAWINOWSKI Jacek
13
0.67
0.07
8
KUSIAK Zygmunt Edward
3
0.15
0.02
9
GRUDZIŃSKI Robert
6
0.31
0.03
10
KRAKOWIAK Leszek Jan
65
3.36
0.34
11
KRASUCKI Wacław Jan
11
0.57
0.06
12
LIPNICKA Anna Elżbieta
449
23.27
2.38
13
MAJEWSKI Jan Wincenty
9
0.46
0.05
14
MALEC Adam
24
1.24
0.13
15
GAGOŚ Robert Wojciech
3
0.15
0.02
16
GLINKA Tomasz Ryszard
208
10.78
1.10
17
DMOWSKA-PUKACZ Alicja Joanna
5
0.25
0.03
18
CIERPIATKA Krzysztof Jan
6
0.31
0.03
19
FILIPEK Kazimierz
13
0.67
0.07
20
ŚCISEŁ Jan Stanisław
0
0.00
0.00
21
BARTUZI Henryk
4
0.20
0.02
22
SZAREK Andrzej Wiktor
202
10.47
1.07
23
BEREJ Elżbieta
0
0.00
0.00
24
ROGOTOWICZ Dariusz Jacek
3
0.15
0.02
25
SZEWCZYK Paweł Kamil
10
0.51
0.05
26
MACIĄG Dariusz Sławomir
7
0.36
0.04
27
SZPAKOWSKA Marianna
16
0.82
0.08
28
DUDZIŃSKA Elżbieta Jadwiga
11
0.57
0.06
29
ZYCHOWICZ Andrzej
6
0.31
0.03
30
DOMŻAŁ-DRZEWICKA Renata Anna
18
0.93
0.10
Σ
1929
100.00
10.20
.
.
Voting Results by location of ward electoral commission.
.
.
.
.
.
.
.
.
.
.
.
.
.
.
.
.
.
No.
Name
No. of entitled
to vote
No. of ballot
papers issued
No. of votes
No. of votes: per list / valid [%]
total
valid
per List
1
City
23235
9498
9481
9101
1468
16.13
2
Country
24932
10360
10352
9798
461
4.71
.
Voting Results by number of inhabitants of commune
.
1
to 5 000
6193
2655
2654
2512
146
5.81
2
from 5 001 to 10 000
10322
4279
4273
4042
202
5.00
3
from 10 001 to 20 000
14867
5915
5901
5656
1098
19.41
4
from 20 001 to 50 000
16785
7009
7005
6689
483
7.22
5
from 50 001 to 100 000
0
0
0
0
0
0.00
6
from 100 001 to 200 000
0
0
0
0
0
0.00
7
from 200 001 to 500 000
0
0
0
0
0
0.00
8
over 500 000
0
0
0
0
0
0.00
Legal Acts
Documents
Electoral Bodies
Election Committees
Turnout
Results
Statistical Data
SENATE
PRESIDENT
Created by
Copyright [c] 2005
Mikrobit Sp. z o.o.
. All Rights Reserved.
top