.
.
Legal Acts
Documents
Electoral Bodies
Election Committees
Turnout
Results
Statistical Data
SENATE
PRESIDENT
Created by
.
.
Voting Results
.
.
.
Voting Results for Committee
.
.
.
.
.
.
.
.
.
.
.
.
.
.
.
.
.
.
.
.
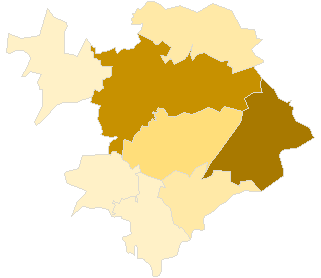
Polska
/
Kielce
/
staszowski, pow.
...
Komitet Wyborczy Centrum
List's Number:
11
No. of valid votes:
19155
No. of votes per List:
196
1.02%
lack
0.14%
0.32%
0.50%
0.68%
0.86%
1.04%
1.22%
1.40%
1.58%
1.76%
not
.
.
.
.
.
.
.
.
.
.
.
.
of data
0.31%
0.49%
0.67%
0.85%
1.03%
1.21%
1.39%
1.57%
1.75%
1.94%
applicable
See also:
Turnout
Votes per Lists
Votes per Candidates
Information about Election Committee
Election results
Voting Results by location of ward electoral commission
.
.
Voting Results for Committee.
.
.
.
.
.
.
.
.
.
.
.
.
.
.
.
.
.
No.
Name
No. of entitled
to vote
No. of ballot papers
issued
No. of votes
No. of votes: per list / valid [%]
total
valid
per List
261201
Bogoria, gm.
6253
1880
1879
1784
8
0.45
261202
Łubnice, gm.
3451
1203
1203
1151
2
0.17
261203
Oleśnica, gm.
3181
1255
1255
1217
3
0.25
261204
Osiek, gm.
6236
2122
2121
2018
39
1.93
261205
Połaniec, gm.
9509
3226
3225
3118
11
0.35
261206
Rytwiany, gm.
5078
1408
1408
1342
10
0.75
261207
Staszów, gm.
21841
7427
7425
7156
121
1.69
261208
Szydłów, gm.
4040
1437
1434
1369
2
0.15
staszowski, pow.
59589
19958
19950
19155
196
1.02
.
.
Voting Results for Candidates
.
.
.
.
.
.
.
.
.
.
.
.
.
.
.
No.
Surname Names
No. of votes
% No. of votes per candidate/No. per list
% No. of votes per candidate/No. of valid votes
1
BERAK Cezary Hubert
3
1.53
0.02
2
KORZENIEWSKI Józef
9
4.59
0.05
3
BYSIAK Sylwester Paweł
1
0.51
0.01
4
OPAŁKO Bronisław Józef
1
0.51
0.01
5
BARCZYK Waldemar Józef
4
2.04
0.02
6
WIĄCEK Tadeusz Wiktor
1
0.51
0.01
7
NOWAK Marek Maciej
2
1.02
0.01
8
CEDRO Barbara Teresa
1
0.51
0.01
9
SKOWRON Edward Mikołaj
80
40.81
0.42
10
WŁODARCZYK Jan Roman
2
1.02
0.01
11
NIBURSKI Krzysztof
0
0.00
0.00
12
KOT Wiesław
83
42.34
0.43
13
KOWALCZYK-KWIECIEŃ Irena Krystyna
1
0.51
0.01
14
LIS Michał Franciszek
0
0.00
0.00
15
FURMANEK Tadeusz
0
0.00
0.00
16
ŁOWICKA Teresa Jadwiga
3
1.53
0.02
17
CIERPIAŁA Jadwiga
2
1.02
0.01
18
SARBIEWSKI Tomasz Przemysław
0
0.00
0.00
19
KUDLIŃSKI Adolf
0
0.00
0.00
20
URA Tadeusz Wincenty
1
0.51
0.01
21
WITKOWSKA Bogusława Danuta
1
0.51
0.01
22
GORCZYCA Grzegorz Marcin
1
0.51
0.01
23
HENDEL Sławomir Andrzej
0
0.00
0.00
24
KOWALSKA Katarzyna
0
0.00
0.00
25
KUCHTA Ewa Anna
0
0.00
0.00
26
PUCHALSKI Robert Rajmund
0
0.00
0.00
27
STERNIK-ZBYDNIOWSKA Małgorzata
0
0.00
0.00
28
ŚLIFIERZ Andrzej
0
0.00
0.00
Σ
196
100.00
1.02
.
.
Voting Results by location of ward electoral commission.
.
.
.
.
.
.
.
.
.
.
.
.
.
.
.
.
.
No.
Name
No. of entitled
to vote
No. of ballot
papers issued
No. of votes
No. of votes: per list / valid [%]
total
valid
per List
1
City
22013
8097
8094
7814
143
1.83
2
Country
37576
11861
11856
11341
53
0.47
.
Voting Results by number of inhabitants of commune
.
1
to 5 000
6632
2458
2458
2368
5
0.21
2
from 5 001 to 10 000
21607
6847
6842
6513
59
0.91
3
from 10 001 to 20 000
9509
3226
3225
3118
11
0.35
4
from 20 001 to 50 000
21841
7427
7425
7156
121
1.69
5
from 50 001 to 100 000
0
0
0
0
0
0.00
6
from 100 001 to 200 000
0
0
0
0
0
0.00
7
from 200 001 to 500 000
0
0
0
0
0
0.00
8
over 500 000
0
0
0
0
0
0.00
Legal Acts
Documents
Electoral Bodies
Election Committees
Turnout
Results
Statistical Data
SENATE
PRESIDENT
Created by
Copyright [c] 2005
Mikrobit Sp. z o.o.
. All Rights Reserved.
top