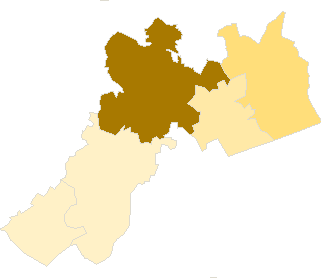
.
.
Legal Acts
Documents
Electoral Bodies
Election Committees
Turnout
Results
Statistical Data
SENATE
PRESIDENT
Created by
.
.
Voting Results
.
.
.
Voting Results for Committee
.
.
.
.
.
.
.
.
.
.
.
.
.
.
.
.
.
.
.
.
Polska
/
Szczecin
/
myśliborski, pow.
...
Komitet Wyborczy Partii Demokratycznej-demokraci.pl
List's Number:
4
No. of valid votes:
16250
No. of votes per List:
894
5.50%
lack
2.65%
3.35%
4.05%
4.75%
5.45%
6.15%
6.85%
7.55%
8.25%
8.95%
not
.
.
.
.
.
.
.
.
.
.
.
.
of data
3.34%
4.04%
4.74%
5.44%
6.14%
6.84%
7.54%
8.24%
8.94%
9.65%
applicable
See also:
Turnout
Votes per Lists
Votes per Candidates
Information about Election Committee
Election results
Voting Results by location of ward electoral commission
.
.
Voting Results for Committee.
.
.
.
.
.
.
.
.
.
.
.
.
.
.
.
.
.
No.
Name
No. of entitled
to vote
No. of ballot papers
issued
No. of votes
No. of votes: per list / valid [%]
total
valid
per List
321001
Barlinek, gm.
15626
5101
5101
4950
242
4.89
321002
Boleszkowice, gm.
2225
565
565
540
17
3.15
321003
Dębno, gm.
16321
5364
5353
5164
137
2.65
321004
Myślibórz, gm.
16814
5182
5176
4977
477
9.58
321005
Nowogródek Pomorski, gm.
2517
654
654
619
21
3.39
myśliborski, pow.
53503
16866
16849
16250
894
5.50
.
.
Voting Results for Candidates
.
.
.
.
.
.
.
.
.
.
.
.
.
.
.
No.
Surname Names
No. of votes
% No. of votes per candidate/No. per list
% No. of votes per candidate/No. of valid votes
1
ŚWIĘCICKI Marcin
95
10.62
0.58
2
POPIELA Radosław Paweł
10
1.11
0.06
3
LINARTOWICZ Elżbieta
10
1.11
0.06
4
NORSESOWICZ Mariusz Grzegorz
502
56.15
3.09
5
UFNIARZ Grzegorz Marek
1
0.11
0.01
6
DEGLER Cecylia Maria
4
0.44
0.02
7
SCHEFS Adam Janusz
2
0.22
0.01
8
WYGANOWSKI Andrzej
8
0.89
0.05
9
DZIEDZIC-KRÓL Łucja Stanisława
1
0.11
0.01
10
DUDA Barbara Maria
7
0.78
0.04
11
RAJEWSKI Przemysław Jan
3
0.33
0.02
12
STRANC Wiesław
2
0.22
0.01
13
WOJNAROWSKI Przemysław Jerzy
7
0.78
0.04
14
PÓŁROLNICZAK Edward
6
0.67
0.04
15
REGNER Janusz Edward
7
0.78
0.04
16
RODZIEWICZ Danuta
6
0.67
0.04
17
BORTNOWSKI Bolesław Jan
184
20.58
1.13
18
ŁUKASIK Beata Maria
8
0.89
0.05
19
SIKORSKI Władysław
4
0.44
0.02
20
KWIECIŃSKI Zdzisław Józef
3
0.33
0.02
21
ZIMNA Joanna
7
0.78
0.04
22
LASKA Ronald Henryk
4
0.44
0.02
23
FABICH Robert
2
0.22
0.01
24
MADEJA Maciej
0
0.00
0.00
25
CIEPIELA Zbigniew Marian
0
0.00
0.00
26
SOBCZAK Andrzej
11
1.23
0.07
Σ
894
100.00
5.50
.
.
Voting Results by location of ward electoral commission.
.
.
.
.
.
.
.
.
.
.
.
.
.
.
.
.
.
No.
Name
No. of entitled
to vote
No. of ballot
papers issued
No. of votes
No. of votes: per list / valid [%]
total
valid
per List
1
City
33149
11615
11609
11244
717
6.38
2
Country
20354
5251
5240
5006
177
3.54
.
Voting Results by number of inhabitants of commune
.
1
to 5 000
4742
1219
1219
1159
38
3.28
2
from 5 001 to 10 000
0
0
0
0
0
0.00
3
from 10 001 to 20 000
15626
5101
5101
4950
242
4.89
4
from 20 001 to 50 000
33135
10546
10529
10141
614
6.05
5
from 50 001 to 100 000
0
0
0
0
0
0.00
6
from 100 001 to 200 000
0
0
0
0
0
0.00
7
from 200 001 to 500 000
0
0
0
0
0
0.00
8
over 500 000
0
0
0
0
0
0.00
Legal Acts
Documents
Electoral Bodies
Election Committees
Turnout
Results
Statistical Data
SENATE
PRESIDENT
Created by
Copyright [c] 2005
Mikrobit Sp. z o.o.
. All Rights Reserved.
top