| . |
. |
Voting Results for Committee |
. |
. |
| . |
. |
| . |
. |
. |
. |
. |
. |
. |
. |
. |
. |
. |
. |
. |
. |
. |
. |
| Polska / Kielce / kielecki, pow. ... |
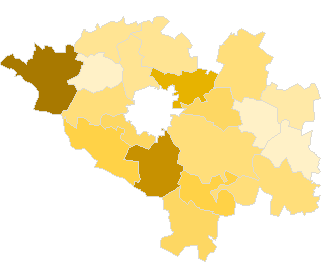 |
| Komitet Wyborczy Partii Demokratycznej-demokraci.pl |
| List's Number: |
4 |
| No. of valid votes: |
48318 |
| No. of votes per List: |
454 |
0.94% |
|
| lack | 0.27% | 0.44% | 0.61% | 0.78% | 0.95% | 1.12% | 1.29% | 1.46% | 1.63% | 1.80% | not | | . | . | . | . | . | . | . | . | . | . | . | . | | of data | 0.43% | 0.60% | 0.77% | 0.94% | 1.11% | 1.28% | 1.45% | 1.62% | 1.79% | 1.97% | applicable |
|
See also:
|
| . |
. |
Voting Results for Committee. |
. |
. |
| . |
. |
| . |
. |
. |
. |
. |
. |
. |
. |
. |
. |
. |
. |
. |
| No. |
Name |
No. of entitled
to vote |
No. of ballot papers
issued |
No. of votes |
No. of votes: per list / valid [%] |
| total |
valid |
per List |
| 260401 | Bieliny, gm. | 7330 | 2228 | 2227 | 2157 | 6 | 0.28 |  |
| 260402 | Bodzentyn, gm. | 9093 | 2766 | 2766 | 2573 | 21 | 0.82 | |
| 260403 | Chęciny, gm. | 11972 | 3914 | 3913 | 3716 | 43 | 1.16 | |
| 260404 | Chmielnik, gm. | 9116 | 3233 | 3232 | 3015 | 33 | 1.09 | |
| 260405 | Daleszyce, gm. | 10863 | 3182 | 3182 | 3068 | 24 | 0.78 | |
| 260406 | Górno, gm. | 9380 | 3120 | 3119 | 2952 | 29 | 0.98 | |
| 260407 | Łagów, gm. | 5488 | 1903 | 1903 | 1832 | 8 | 0.44 | |
| 260408 | Łopuszno, gm. | 6889 | 2475 | 2475 | 2378 | 46 | 1.93 | |
| 260409 | Masłów, gm. | 7215 | 2520 | 2506 | 2436 | 36 | 1.48 | |
| 260410 | Miedziana Góra, gm. | 7565 | 2828 | 2827 | 2707 | 21 | 0.78 | |
| 260411 | Mniów, gm. | 6969 | 2423 | 2421 | 2297 | 16 | 0.70 | |
| 260412 | Morawica, gm. | 9841 | 3082 | 3079 | 2966 | 51 | 1.72 | |
| 260413 | Nowa Słupia, gm. | 7956 | 2091 | 2090 | 2011 | 9 | 0.45 | |
| 260414 | Piekoszów, gm. | 11348 | 3532 | 3502 | 3382 | 27 | 0.80 | |
| 260415 | Pierzchnica, gm. | 3611 | 1103 | 1103 | 1035 | 13 | 1.26 | |
| 260416 | Raków, gm. | 4796 | 1597 | 1597 | 1546 | 14 | 0.91 | |
| 260417 | Sitkówka-Nowiny, gm. | 5286 | 1909 | 1908 | 1808 | 19 | 1.05 | |
| 260418 | Strawczyn, gm. | 7158 | 2724 | 2703 | 2598 | 10 | 0.38 | |
| 260419 | Zagnańsk, gm. | 9859 | 3964 | 3962 | 3841 | 28 | 0.73 | |
| |
kielecki, pow. |
151735 |
50594 |
50515 |
48318 |
454 |
0.94 |
 |
|
| |
| . |
. |
Voting Results by location of ward electoral commission. |
. |
. |
| . |
. |
| . |
. |
. |
. |
. |
. |
. |
. |
. |
. |
. |
. |
. |
| No. |
Name |
No. of entitled
to vote |
No. of ballot
papers issued |
No. of votes |
No. of votes: per list / valid [%] |
| total |
valid |
per List |
| 1 | City | 11949 | 4403 | 4402 | 4167 | 52 | 1.25 | |
| 2 | Country | 139786 | 46191 | 46113 | 44151 | 402 | 0.91 | |
| . |
Voting Results by number of inhabitants of commune |
. |
| 1 | to 5 000 | 3611 | 1103 | 1103 | 1035 | 13 | 1.26 | |
| 2 | from 5 001 to 10 000 | 58696 | 20607 | 20567 | 19759 | 176 | 0.89 | |
| 3 | from 10 001 to 20 000 | 89428 | 28884 | 28845 | 27524 | 265 | 0.96 | |
| 4 | from 20 001 to 50 000 | 0 | 0 | 0 | 0 | 0 | 0.00 | |
| 5 | from 50 001 to 100 000 | 0 | 0 | 0 | 0 | 0 | 0.00 | |
| 6 | from 100 001 to 200 000 | 0 | 0 | 0 | 0 | 0 | 0.00 | |
| 7 | from 200 001 to 500 000 | 0 | 0 | 0 | 0 | 0 | 0.00 | |
| 8 | over 500 000 | 0 | 0 | 0 | 0 | 0 | 0.00 | |
|
|


 Legal Acts
 Legal Acts