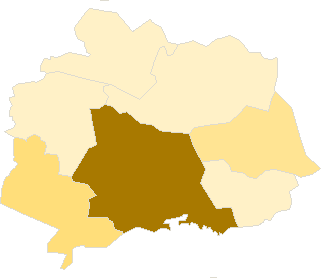
.
.
Legal Acts
Documents
Electoral Bodies
Election Committees
Turnout
Results
Statistical Data
SENATE
PRESIDENT
Created by
.
.
Voting Results
.
.
.
Voting Results for Committee
.
.
.
.
.
.
.
.
.
.
.
.
.
.
.
.
.
.
.
.
Polska
/
Kraków
/
miechowski, pow.
...
Komitet Wyborczy Partii Demokratycznej-demokraci.pl
List's Number:
4
No. of valid votes:
13951
No. of votes per List:
174
1.25%
lack
0.34%
0.53%
0.72%
0.91%
1.10%
1.29%
1.48%
1.67%
1.86%
2.05%
not
.
.
.
.
.
.
.
.
.
.
.
.
of data
0.52%
0.71%
0.90%
1.09%
1.28%
1.47%
1.66%
1.85%
2.04%
2.24%
applicable
See also:
Turnout
Votes per Lists
Votes per Candidates
Information about Election Committee
Election results
Voting Results by location of ward electoral commission
.
.
Voting Results for Committee.
.
.
.
.
.
.
.
.
.
.
.
.
.
.
.
.
.
No.
Name
No. of entitled
to vote
No. of ballot papers
issued
No. of votes
No. of votes: per list / valid [%]
total
valid
per List
120801
Charsznica, gm.
6348
2377
2376
2310
9
0.39
120802
Gołcza, gm.
5050
1870
1870
1758
18
1.02
120803
Kozłów, gm.
4040
1226
1222
1196
6
0.50
120804
Książ Wielki, gm.
4495
1573
1573
1507
6
0.40
120805
Miechów, gm.
16295
5759
5746
5541
124
2.24
120806
Racławice, gm.
2045
609
609
585
2
0.34
120807
Słaboszów, gm.
3221
1112
1112
1054
9
0.85
miechowski, pow.
41494
14526
14508
13951
174
1.25
.
.
Voting Results for Candidates
.
.
.
.
.
.
.
.
.
.
.
.
.
.
.
No.
Surname Names
No. of votes
% No. of votes per candidate/No. per list
% No. of votes per candidate/No. of valid votes
1
HAUSNER Jerzy Krzysztof
60
34.48
0.43
2
OKOŃSKI Jan Józef
8
4.59
0.06
3
KUŹNIAK Brygida Justyna
4
2.29
0.03
4
PIETRASZEWSKI Grzegorz Andrzej
6
3.44
0.04
5
CZUDEJ Arkadiusz Robert
2
1.14
0.01
6
SOLARZ Agnieszka Sylwia
4
2.29
0.03
7
TOMSIA Łukasz Konrad
0
0.00
0.00
8
KRĄPIEC Marek Antoni
2
1.14
0.01
9
ŁOPACIŃSKA Elżbieta Danuta
0
0.00
0.00
10
WŁODARCZYK Robert Wojciech
69
39.65
0.49
11
RADZIKOWSKA Zofia
2
1.14
0.01
12
KOWERSKI Jacenty
0
0.00
0.00
13
PALASZEWSKI Adam Marian
1
0.57
0.01
14
TYLEK Dariusz Adam
1
0.57
0.01
15
KĄCKI Piotr Zdzisław
1
0.57
0.01
16
DĄBROWSKA Krystyna Elżbieta
3
1.72
0.02
17
KASPERCZYK Adam Marian
2
1.14
0.01
18
ŻELAZNY Robert
3
1.72
0.02
19
NOWICKA Joanna Małgorzata
2
1.14
0.01
20
MINDUR Andrzej Mateusz
1
0.57
0.01
21
MISZEWSKI Zbigniew Zygmunt
1
0.57
0.01
22
WOJTANEK Paweł Andrzej
0
0.00
0.00
23
ZYGUŁA Andrzej Stanisław
1
0.57
0.01
24
BALUCH Wojciech Jan
1
0.57
0.01
Σ
174
100.00
1.24
.
.
Voting Results by location of ward electoral commission.
.
.
.
.
.
.
.
.
.
.
.
.
.
.
.
.
.
No.
Name
No. of entitled
to vote
No. of ballot
papers issued
No. of votes
No. of votes: per list / valid [%]
total
valid
per List
1
City
9852
3977
3965
3821
102
2.67
2
Country
31642
10549
10543
10130
72
0.71
.
Voting Results by number of inhabitants of commune
.
1
to 5 000
5266
1721
1721
1639
11
0.67
2
from 5 001 to 10 000
19933
7046
7041
6771
39
0.58
3
from 10 001 to 20 000
0
0
0
0
0
0.00
4
from 20 001 to 50 000
16295
5759
5746
5541
124
2.24
5
from 50 001 to 100 000
0
0
0
0
0
0.00
6
from 100 001 to 200 000
0
0
0
0
0
0.00
7
from 200 001 to 500 000
0
0
0
0
0
0.00
8
over 500 000
0
0
0
0
0
0.00
Legal Acts
Documents
Electoral Bodies
Election Committees
Turnout
Results
Statistical Data
SENATE
PRESIDENT
Created by
Copyright [c] 2005
Mikrobit Sp. z o.o.
. All Rights Reserved.
top