.
.
 
. .
Voting Results
.
. . Voting Results for Committee . .
. .
. . . . . . . . . . . . . . . .
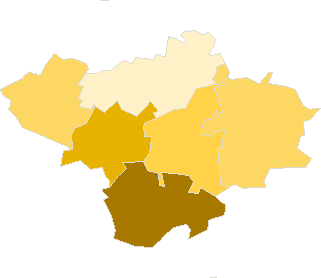
Polska / Lublin / łęczyński, pow. ...
Komitet Wyborczy Partii Demokratycznej-demokraci.pl
List's Number: 4
No. of valid votes: 14492
No. of votes per List: 114
0.79%
lack0.26%0.34%0.42%0.50%0.58%0.66%0.74%0.82%0.90%0.98%not
............
of data0.33%0.41%0.49%0.57%0.65%0.73%0.81%0.89%0.97%1.06%applicable

See also:
. . Voting Results for Committee. . .
. .
. . . . . . . . . . . . .
No. Name No. of entitled
to vote
No. of ballot papers
issued
No. of votes No. of votes: per list / valid [%]
total valid per List
061001Cyców, gm.5702186518651760110.63
061002Ludwin, gm.375011901190114030.26
061003Łęczna, gm.19087739273887154630.88
061004Milejów, gm.7289202720271887201.06
061005Puchaczów, gm.376813131313126490.71
061006Spiczyn, gm.407813611361128780.62
  łęczyński, pow. 43674 15148 15144 14492 114 0.79

. . Voting Results for Candidates . .
. .
. . . . . . . . . . .
No. Surname Names No. of votes % No. of votes per candidate/No. per list % No. of votes per candidate/No. of valid votes
1CELIŃSKI Marcin Grzegorz4539.470.31
2ŁUCJAN Henryk119.640.08
3WILCZYŃSKA-CIEMIĘGA Krystyna Maria1311.400.09
4KIJEK Waldemar Jan10.870.01
5BOCIAN Roman Andrzej00.00 0.00 
6ŚRODEK Borys Konrad00.00 0.00 
7KUŹMICKI Krzysztof Maciej00.00 0.00 
8CZELEJ Michał Jacek10.870.01
9JAWORSKI Jerzy Lech43.500.03
10KLIMOWICZ Teresa Urszula32.630.02
11SZKUTNIK Grzegorz32.630.02
12POLAŃSKI Marcin Janusz54.380.03
13BERNAT Jarosław Marek10.870.01
14CICHOSZ Edward Franciszek10.870.01
15PODLEŚNY Maciej Janusz32.630.02
16SIENKIEWICZ Mariusz Wiktor43.500.03
17SIWIEC Tomasz Gerard21.750.01
18BORUCH Dariusz Piotr10.870.01
19HARAŃCZUK Elżbieta21.750.01
20RYMKIEWICZ Grzegorz00.00 0.00 
21ROGALA Stanisław Janusz10.870.01
22BARTKIEWICZ Tadeusz00.00 0.00 
23PYŁA Robert10.870.01
24KWIATKOWSKI Włodzimierz Piotr00.00 0.00 
25KĘPKA Ewa54.380.03
26ROZWADOWSKI Dariusz Adam00.00 0.00 
27OSIAK Urszula Janina32.630.02
28LEJWODA Lech21.750.01
29TRZPIL Grzegorz Artur00.00 0.00 
30TROJAK Jarosław21.750.01
Σ   114 100.00 0.78
 
. . Voting Results by location of ward electoral commission. . .
. .
. . . . . . . . . . . . .
No. Name No. of entitled
to vote
No. of ballot
papers issued
No. of votes No. of votes: per list / valid [%]
total valid per List
1City16389657165676349610.96
2Country27285857785778143530.65
. Voting Results by number of inhabitants of commune .
1to 5 000376813131313126490.71
2from 5 001 to 10 00020819644364436074420.69
3from 10 001 to 20 000000000.00 
4from 20 001 to 50 00019087739273887154630.88
5from 50 001 to 100 000000000.00 
6from 100 001 to 200 000000000.00 
7from 200 001 to 500 000000000.00 
8over 500 000000000.00 

  Legal Acts Documents Electoral Bodies Election Committees Turnout Results Statistical Data SENATE PRESIDENT Created by
 top