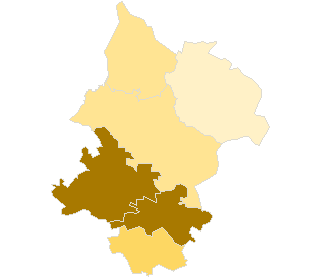
.
.
Legal Acts
Documents
Electoral Bodies
Election Committees
Turnout
Results
Statistical Data
SENATE
PRESIDENT
Created by
.
.
Voting Results
.
.
.
Voting Results for Committee
.
.
.
.
.
.
.
.
.
.
.
.
.
.
.
.
.
.
.
.
Polska
/
Kielce
/
włoszczowski, pow.
...
Komitet Wyborczy Ruch Patriotyczny
List's Number:
1
No. of valid votes:
12835
No. of votes per List:
370
2.88%
lack
1.34%
1.80%
2.26%
2.72%
3.18%
3.64%
4.10%
4.56%
5.02%
5.48%
not
.
.
.
.
.
.
.
.
.
.
.
.
of data
1.79%
2.25%
2.71%
3.17%
3.63%
4.09%
4.55%
5.01%
5.47%
5.94%
applicable
See also:
Turnout
Votes per Lists
Votes per Candidates
Information about Election Committee
Election results
Voting Results by location of ward electoral commission
.
.
Voting Results for Committee.
.
.
.
.
.
.
.
.
.
.
.
.
.
.
.
.
.
No.
Name
No. of entitled
to vote
No. of ballot papers
issued
No. of votes
No. of votes: per list / valid [%]
total
valid
per List
261301
Kluczewsko, gm.
4047
1491
1490
1395
33
2.37
261302
Krasocin, gm.
8348
2850
2849
2680
36
1.34
261303
Moskorzew, gm.
2444
901
901
853
31
3.63
261304
Radków, gm.
2193
666
666
637
35
5.49
261305
Secemin, gm.
4255
1298
1298
1242
73
5.88
261306
Włoszczowa, gm.
16395
6329
6324
6028
162
2.69
włoszczowski, pow.
37682
13535
13528
12835
370
2.88
.
.
Voting Results for Candidates
.
.
.
.
.
.
.
.
.
.
.
.
.
.
.
No.
Surname Names
No. of votes
% No. of votes per candidate/No. per list
% No. of votes per candidate/No. of valid votes
1
POTRZESZCZ Jarosław
27
7.29
0.21
2
STĘPIEŃ Marek Bogusław
15
4.05
0.12
3
GARBAT Adam Wiesław
4
1.08
0.03
4
RYK Jan
1
0.27
0.01
5
BĄK Józef Stanisław
7
1.89
0.05
6
KACZOR Krzysztof Robert
12
3.24
0.09
7
TOMASZEWSKI Czesław Sergiusz
186
50.27
1.45
8
WÓJCIK Marcin
3
0.81
0.02
9
SAGAN Józef
2
0.54
0.02
10
PŁUSA Szymon Wacław
3
0.81
0.02
11
WÓJTOWICZ Jerzy Stefan
1
0.27
0.01
12
KRUK Dorota Beata
1
0.27
0.01
13
BARAŃSKA Krystyna
3
0.81
0.02
14
ŁODEJSKI Stanisław Wacław
1
0.27
0.01
15
KOWALCZYK Bogusław
7
1.89
0.05
16
WASIŃSKI Stefan Bogdan
1
0.27
0.01
17
GRUSZCZYŃSKI Jerzy
4
1.08
0.03
18
KROWIŃSKA Zofia
2
0.54
0.02
19
MUSZKAT Lidia Barbara
11
2.97
0.09
20
ORACZ Jan Kazimierz
61
16.48
0.48
21
KOWALCZYK Franciszek
4
1.08
0.03
22
BERNAT Dariusz Janusz
1
0.27
0.01
23
SOBOCKI Sławomir
0
0.00
0.00
24
MRUGAŁA Ewa
2
0.54
0.02
25
KOSMA Andrzej Seweryn
1
0.27
0.01
26
KAJZIK Jolanta Maria
1
0.27
0.01
27
MOTYL Roman Jerzy
4
1.08
0.03
28
BARUCHA Adam
1
0.27
0.01
29
BARAŃSKA Joanna Dorota
0
0.00
0.00
30
ŚLIWA Bogdan Jan
1
0.27
0.01
31
WÓJTOWICZ Alina
1
0.27
0.01
32
CEBULA Zbigniew Leszek
2
0.54
0.02
Σ
370
100.00
2.88
.
.
Voting Results by location of ward electoral commission.
.
.
.
.
.
.
.
.
.
.
.
.
.
.
.
.
.
No.
Name
No. of entitled
to vote
No. of ballot
papers issued
No. of votes
No. of votes: per list / valid [%]
total
valid
per List
1
City
8993
3751
3746
3603
105
2.91
2
Country
28689
9784
9782
9232
265
2.87
.
Voting Results by number of inhabitants of commune
.
1
to 5 000
4637
1567
1567
1490
66
4.43
2
from 5 001 to 10 000
8302
2789
2788
2637
106
4.02
3
from 10 001 to 20 000
8348
2850
2849
2680
36
1.34
4
from 20 001 to 50 000
16395
6329
6324
6028
162
2.69
5
from 50 001 to 100 000
0
0
0
0
0
0.00
6
from 100 001 to 200 000
0
0
0
0
0
0.00
7
from 200 001 to 500 000
0
0
0
0
0
0.00
8
over 500 000
0
0
0
0
0
0.00
Legal Acts
Documents
Electoral Bodies
Election Committees
Turnout
Results
Statistical Data
SENATE
PRESIDENT
Created by
Copyright [c] 2005
Mikrobit Sp. z o.o.
. All Rights Reserved.
top