.
.
Legal Acts
Documents
Electoral Bodies
Election Committees
Turnout
Results
Statistical Data
SENATE
PRESIDENT
Created by
.
.
Voting Results
.
.
.
Voting Results for Committee
.
.
.
.
.
.
.
.
.
.
.
.
.
.
.
.
.
.
.
.
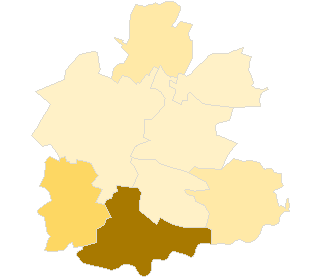
Polska
/
Kielce
/
buski, pow.
...
Komitet Wyborczy Ruch Patriotyczny
List's Number:
1
No. of valid votes:
21331
No. of votes per List:
381
1.79%
lack
0.47%
1.30%
2.13%
2.96%
3.79%
4.62%
5.45%
6.28%
7.11%
7.94%
not
.
.
.
.
.
.
.
.
.
.
.
.
of data
1.29%
2.12%
2.95%
3.78%
4.61%
5.44%
6.27%
7.10%
7.93%
8.77%
applicable
See also:
Turnout
Votes per Lists
Votes per Candidates
Information about Election Committee
Election results
Voting Results by location of ward electoral commission
.
.
Voting Results for Committee.
.
.
.
.
.
.
.
.
.
.
.
.
.
.
.
.
.
No.
Name
No. of entitled
to vote
No. of ballot papers
issued
No. of votes
No. of votes: per list / valid [%]
total
valid
per List
260101
Busko-Zdrój, gm.
27624
10165
10158
9805
86
0.88
260102
Gnojno, gm.
3809
1222
1222
1178
17
1.44
260103
Nowy Korczyn, gm.
5354
1886
1886
1818
158
8.69
260104
Pacanów, gm.
6589
2004
2003
1934
27
1.40
260105
Solec-Zdrój, gm.
4105
1885
1885
1828
14
0.77
260106
Stopnica, gm.
6565
2251
2246
2154
19
0.88
260107
Tuczępy, gm.
3050
1320
1320
1258
6
0.48
260108
Wiślica, gm.
4840
1420
1413
1356
54
3.98
buski, pow.
61936
22153
22133
21331
381
1.79
.
.
Voting Results for Candidates
.
.
.
.
.
.
.
.
.
.
.
.
.
.
.
No.
Surname Names
No. of votes
% No. of votes per candidate/No. per list
% No. of votes per candidate/No. of valid votes
1
POTRZESZCZ Jarosław
48
12.59
0.23
2
STĘPIEŃ Marek Bogusław
19
4.98
0.09
3
GARBAT Adam Wiesław
3
0.78
0.01
4
RYK Jan
3
0.78
0.01
5
BĄK Józef Stanisław
15
3.93
0.07
6
KACZOR Krzysztof Robert
10
2.62
0.05
7
TOMASZEWSKI Czesław Sergiusz
3
0.78
0.01
8
WÓJCIK Marcin
11
2.88
0.05
9
SAGAN Józef
219
57.48
1.03
10
PŁUSA Szymon Wacław
5
1.31
0.02
11
WÓJTOWICZ Jerzy Stefan
3
0.78
0.01
12
KRUK Dorota Beata
2
0.52
0.01
13
BARAŃSKA Krystyna
0
0.00
0.00
14
ŁODEJSKI Stanisław Wacław
2
0.52
0.01
15
KOWALCZYK Bogusław
12
3.14
0.06
16
WASIŃSKI Stefan Bogdan
1
0.26
0.00
17
GRUSZCZYŃSKI Jerzy
0
0.00
0.00
18
KROWIŃSKA Zofia
3
0.78
0.01
19
MUSZKAT Lidia Barbara
0
0.00
0.00
20
ORACZ Jan Kazimierz
0
0.00
0.00
21
KOWALCZYK Franciszek
2
0.52
0.01
22
BERNAT Dariusz Janusz
0
0.00
0.00
23
SOBOCKI Sławomir
0
0.00
0.00
24
MRUGAŁA Ewa
3
0.78
0.01
25
KOSMA Andrzej Seweryn
1
0.26
0.00
26
KAJZIK Jolanta Maria
0
0.00
0.00
27
MOTYL Roman Jerzy
1
0.26
0.00
28
BARUCHA Adam
0
0.00
0.00
29
BARAŃSKA Joanna Dorota
5
1.31
0.02
30
ŚLIWA Bogdan Jan
4
1.04
0.02
31
WÓJTOWICZ Alina
4
1.04
0.02
32
CEBULA Zbigniew Leszek
2
0.52
0.01
Σ
381
100.00
1.78
.
.
Voting Results by location of ward electoral commission.
.
.
.
.
.
.
.
.
.
.
.
.
.
.
.
.
.
No.
Name
No. of entitled
to vote
No. of ballot
papers issued
No. of votes
No. of votes: per list / valid [%]
total
valid
per List
1
City
15258
6405
6398
6185
51
0.82
2
Country
46678
15748
15735
15146
330
2.18
.
Voting Results by number of inhabitants of commune
.
1
to 5 000
6859
2542
2542
2436
23
0.94
2
from 5 001 to 10 000
27453
9446
9433
9090
272
2.99
3
from 10 001 to 20 000
0
0
0
0
0
0.00
4
from 20 001 to 50 000
27624
10165
10158
9805
86
0.88
5
from 50 001 to 100 000
0
0
0
0
0
0.00
6
from 100 001 to 200 000
0
0
0
0
0
0.00
7
from 200 001 to 500 000
0
0
0
0
0
0.00
8
over 500 000
0
0
0
0
0
0.00
Legal Acts
Documents
Electoral Bodies
Election Committees
Turnout
Results
Statistical Data
SENATE
PRESIDENT
Created by
Copyright [c] 2005
Mikrobit Sp. z o.o.
. All Rights Reserved.
top