| . |
. |
Voting Results for Committee |
. |
. |
| . |
. |
| . |
. |
. |
. |
. |
. |
. |
. |
. |
. |
. |
. |
. |
. |
. |
. |
| Polska / Lublin / kraśnicki, pow. ... |
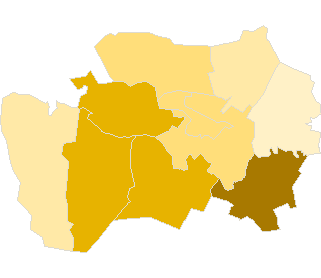 |
| Komitet Wyborczy Ruch Patriotyczny |
| List's Number: |
1 |
| No. of valid votes: |
33418 |
| No. of votes per List: |
248 |
0.74% |
|
| lack | 0.45% | 0.52% | 0.59% | 0.66% | 0.73% | 0.80% | 0.87% | 0.94% | 1.01% | 1.08% | not | | . | . | . | . | . | . | . | . | . | . | . | . | | of data | 0.51% | 0.58% | 0.65% | 0.72% | 0.79% | 0.86% | 0.93% | 1.00% | 1.07% | 1.15% | applicable |
|
See also:
|
| . |
. |
Voting Results for Committee. |
. |
. |
| . |
. |
| . |
. |
. |
. |
. |
. |
. |
. |
. |
. |
. |
. |
. |
| No. |
Name |
No. of entitled
to vote |
No. of ballot papers
issued |
No. of votes |
No. of votes: per list / valid [%] |
| total |
valid |
per List |
| 060702 | Annopol, gm. | 7343 | 3086 | 3075 | 2911 | 16 | 0.55 |  |
| 060703 | Dzierzkowice, gm. | 4233 | 1828 | 1828 | 1746 | 17 | 0.97 | |
| 060704 | Gościeradów, gm. | 5741 | 1840 | 1839 | 1765 | 17 | 0.96 | |
| 060705 | Kraśnik, gm. | 5453 | 2277 | 2275 | 2190 | 15 | 0.68 | |
| 060701 | Kraśnik, m. | 30474 | 14303 | 14286 | 13712 | 100 | 0.73 | |
| 060706 | Szastarka, gm. | 4918 | 2046 | 2042 | 1932 | 22 | 1.14 | |
| 060707 | Trzydnik Duży, gm. | 5494 | 2142 | 2142 | 2029 | 20 | 0.99 | |
| 060708 | Urzędów, gm. | 6958 | 3147 | 3147 | 2988 | 20 | 0.67 | |
| 060709 | Wilkołaz, gm. | 4357 | 1998 | 1996 | 1924 | 11 | 0.57 | |
| 060710 | Zakrzówek, gm. | 5670 | 2317 | 2317 | 2221 | 10 | 0.45 | |
| |
kraśnicki, pow. |
80641 |
34984 |
34947 |
33418 |
248 |
0.74 |
 |
|
| |
| . |
. |
Voting Results by location of ward electoral commission. |
. |
. |
| . |
. |
| . |
. |
. |
. |
. |
. |
. |
. |
. |
. |
. |
. |
. |
| No. |
Name |
No. of entitled
to vote |
No. of ballot
papers issued |
No. of votes |
No. of votes: per list / valid [%] |
| total |
valid |
per List |
| 1 | City | 32949 | 15437 | 15420 | 14771 | 104 | 0.70 | |
| 2 | Country | 47692 | 19547 | 19527 | 18647 | 144 | 0.77 | |
| . |
Voting Results by number of inhabitants of commune |
. |
| 1 | to 5 000 | 0 | 0 | 0 | 0 | 0 | 0.00 | |
| 2 | from 5 001 to 10 000 | 50167 | 20681 | 20661 | 19706 | 148 | 0.75 | |
| 3 | from 10 001 to 20 000 | 0 | 0 | 0 | 0 | 0 | 0.00 | |
| 4 | from 20 001 to 50 000 | 30474 | 14303 | 14286 | 13712 | 100 | 0.73 | |
| 5 | from 50 001 to 100 000 | 0 | 0 | 0 | 0 | 0 | 0.00 | |
| 6 | from 100 001 to 200 000 | 0 | 0 | 0 | 0 | 0 | 0.00 | |
| 7 | from 200 001 to 500 000 | 0 | 0 | 0 | 0 | 0 | 0.00 | |
| 8 | over 500 000 | 0 | 0 | 0 | 0 | 0 | 0.00 | |
|
|


 Legal Acts
 Legal Acts