| . |
. |
Voting Results for Committee |
. |
. |
| . |
. |
| . |
. |
. |
. |
. |
. |
. |
. |
. |
. |
. |
. |
. |
. |
. |
. |
| Polska / Bielsko-Biała / cieszyński, pow. ... |
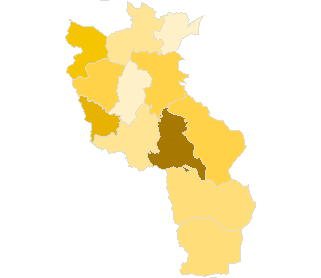 |
| Komitet Wyborczy Platformy Janusza Korwin-Mikke |
| List's Number: |
12 |
| No. of valid votes: |
51514 |
| No. of votes per List: |
912 |
1.77% |
|
| lack | 0.82% | 1.00% | 1.18% | 1.36% | 1.54% | 1.72% | 1.90% | 2.08% | 2.26% | 2.44% | not | | . | . | . | . | . | . | . | . | . | . | . | . | | of data | 0.99% | 1.17% | 1.35% | 1.53% | 1.71% | 1.89% | 2.07% | 2.25% | 2.43% | 2.62% | applicable |
|
See also:
|
| . |
. |
Voting Results for Committee. |
. |
. |
| . |
. |
| . |
. |
. |
. |
. |
. |
. |
. |
. |
. |
. |
. |
. |
| No. |
Name |
No. of entitled
to vote |
No. of ballot papers
issued |
No. of votes |
No. of votes: per list / valid [%] |
| total |
valid |
per List |
| 240304 | Brenna, gm. | 7677 | 2868 | 2868 | 2737 | 49 | 1.79 |  |
| 240305 | Chybie, gm. | 6929 | 2958 | 2956 | 2821 | 26 | 0.92 | |
| 240301 | Cieszyn, m. | 29060 | 12115 | 12075 | 11665 | 245 | 2.10 | |
| 240306 | Dębowiec, gm. | 4107 | 1503 | 1503 | 1463 | 12 | 0.82 | |
| 240307 | Goleszów, gm. | 9632 | 3381 | 3381 | 3241 | 40 | 1.23 | |
| 240308 | Hażlach, gm. | 7271 | 2573 | 2573 | 2469 | 44 | 1.78 | |
| 240309 | Istebna, gm. | 8326 | 4094 | 4089 | 3937 | 59 | 1.50 | |
| 240310 | Skoczów, gm. | 20003 | 7962 | 7901 | 7580 | 138 | 1.82 | |
| 240311 | Strumień, gm. | 9095 | 3815 | 3815 | 3650 | 45 | 1.23 | |
| 240302 | Ustroń, m. | 13266 | 5625 | 5617 | 5412 | 140 | 2.59 | |
| 240303 | Wisła, m. | 9168 | 2918 | 2917 | 2798 | 41 | 1.47 | |
| 240312 | Zebrzydowice, gm. | 9546 | 3866 | 3860 | 3741 | 73 | 1.95 | |
| |
cieszyński, pow. |
134080 |
53678 |
53555 |
51514 |
912 |
1.77 |
 |
|
| |
| . |
. |
Voting Results by location of ward electoral commission. |
. |
. |
| . |
. |
| . |
. |
. |
. |
. |
. |
. |
. |
. |
. |
. |
. |
. |
| No. |
Name |
No. of entitled
to vote |
No. of ballot
papers issued |
No. of votes |
No. of votes: per list / valid [%] |
| total |
valid |
per List |
| 1 | City | 65919 | 26727 | 26652 | 25705 | 527 | 2.05 | |
| 2 | Country | 68161 | 26951 | 26903 | 25809 | 385 | 1.49 | |
| . |
Voting Results by number of inhabitants of commune |
. |
| 1 | to 5 000 | 0 | 0 | 0 | 0 | 0 | 0.00 | |
| 2 | from 5 001 to 10 000 | 18307 | 7034 | 7032 | 6753 | 82 | 1.21 | |
| 3 | from 10 001 to 20 000 | 66710 | 26567 | 26547 | 25516 | 447 | 1.75 | |
| 4 | from 20 001 to 50 000 | 49063 | 20077 | 19976 | 19245 | 383 | 1.99 | |
| 5 | from 50 001 to 100 000 | 0 | 0 | 0 | 0 | 0 | 0.00 | |
| 6 | from 100 001 to 200 000 | 0 | 0 | 0 | 0 | 0 | 0.00 | |
| 7 | from 200 001 to 500 000 | 0 | 0 | 0 | 0 | 0 | 0.00 | |
| 8 | over 500 000 | 0 | 0 | 0 | 0 | 0 | 0.00 | |
|
|


 Legal Acts
 Legal Acts