| . |
. |
Voting Results for Committee |
. |
. |
| . |
. |
| . |
. |
. |
. |
. |
. |
. |
. |
. |
. |
. |
. |
. |
. |
. |
. |
| Polska / Krosno / jarosławski, pow. ... |
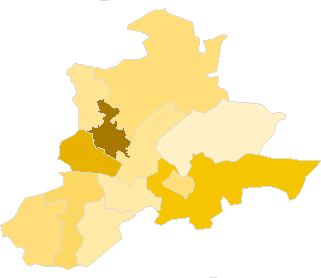 |
| Komitet Wyborczy Platformy Janusza Korwin-Mikke |
| List's Number: |
12 |
| No. of valid votes: |
41484 |
| No. of votes per List: |
303 |
0.73% |
|
| lack | 0.33% | 0.40% | 0.47% | 0.54% | 0.61% | 0.68% | 0.75% | 0.82% | 0.89% | 0.96% | not | | . | . | . | . | . | . | . | . | . | . | . | . | | of data | 0.39% | 0.46% | 0.53% | 0.60% | 0.67% | 0.74% | 0.81% | 0.88% | 0.95% | 1.03% | applicable |
|
See also:
|
| . |
. |
Voting Results for Committee. |
. |
. |
| . |
. |
| . |
. |
. |
. |
. |
. |
. |
. |
. |
. |
. |
. |
. |
| No. |
Name |
No. of entitled
to vote |
No. of ballot papers
issued |
No. of votes |
No. of votes: per list / valid [%] |
| total |
valid |
per List |
| 180403 | Chłopice, gm. | 4310 | 1830 | 1829 | 1734 | 8 | 0.46 |  |
| 180404 | Jarosław, gm. | 9697 | 4069 | 4069 | 3899 | 20 | 0.51 | |
| 180401 | Jarosław, m. | 32662 | 15207 | 15204 | 14809 | 144 | 0.97 | |
| 180405 | Laszki, gm. | 5358 | 2515 | 2514 | 2398 | 8 | 0.33 | |
| 180406 | Pawłosiów, gm. | 6155 | 2917 | 2909 | 2838 | 24 | 0.85 | |
| 180407 | Pruchnik, gm. | 7113 | 3278 | 3268 | 3146 | 18 | 0.57 | |
| 180408 | Radymno, gm. | 8655 | 3675 | 3656 | 3538 | 29 | 0.82 | |
| 180402 | Radymno, m. | 4242 | 1872 | 1869 | 1820 | 10 | 0.55 | |
| 180409 | Rokietnica, gm. | 3354 | 1223 | 1221 | 1166 | 5 | 0.43 | |
| 180410 | Roźwienica, gm. | 4802 | 2153 | 2153 | 2074 | 14 | 0.68 | |
| 180411 | Wiązownica, gm. | 8323 | 4222 | 4207 | 4062 | 23 | 0.57 | |
| |
jarosławski, pow. |
94671 |
42961 |
42899 |
41484 |
303 |
0.73 |
 |
|
| |
| . |
. |
Voting Results by location of ward electoral commission. |
. |
. |
| . |
. |
| . |
. |
. |
. |
. |
. |
. |
. |
. |
. |
. |
. |
. |
| No. |
Name |
No. of entitled
to vote |
No. of ballot
papers issued |
No. of votes |
No. of votes: per list / valid [%] |
| total |
valid |
per List |
| 1 | City | 36904 | 17079 | 17073 | 16629 | 154 | 0.93 | |
| 2 | Country | 57767 | 25882 | 25826 | 24855 | 149 | 0.60 | |
| . |
Voting Results by number of inhabitants of commune |
. |
| 1 | to 5 000 | 3354 | 1223 | 1221 | 1166 | 5 | 0.43 | |
| 2 | from 5 001 to 10 000 | 31980 | 14565 | 14542 | 14010 | 82 | 0.59 | |
| 3 | from 10 001 to 20 000 | 26675 | 11966 | 11932 | 11499 | 72 | 0.63 | |
| 4 | from 20 001 to 50 000 | 32662 | 15207 | 15204 | 14809 | 144 | 0.97 | |
| 5 | from 50 001 to 100 000 | 0 | 0 | 0 | 0 | 0 | 0.00 | |
| 6 | from 100 001 to 200 000 | 0 | 0 | 0 | 0 | 0 | 0.00 | |
| 7 | from 200 001 to 500 000 | 0 | 0 | 0 | 0 | 0 | 0.00 | |
| 8 | over 500 000 | 0 | 0 | 0 | 0 | 0 | 0.00 | |
|
|


 Legal Acts
 Legal Acts