.
.
Legal Acts
Documents
Electoral Bodies
Election Committees
Turnout
Results
Statistical Data
SENATE
PRESIDENT
Created by
.
.
Voting Results
.
.
.
Voting Results for Committee
.
.
.
.
.
.
.
.
.
.
.
.
.
.
.
.
.
.
.
.
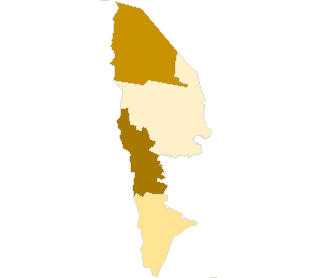
Polska
/
Szczecin
/
policki, pow.
...
Komitet Wyborczy Platforma Obywatelska RP
List's Number:
8
No. of valid votes:
17101
No. of votes per List:
6231
36.44%
lack
33.91%
34.91%
35.91%
36.91%
37.91%
38.91%
39.91%
40.91%
41.91%
42.91%
not
.
.
.
.
.
.
.
.
.
.
.
.
of data
34.90%
35.90%
36.90%
37.90%
38.90%
39.90%
40.90%
41.90%
42.90%
43.91%
applicable
See also:
Turnout
Votes per Lists
Votes per Candidates
Information about Election Committee
Election results
Voting Results by location of ward electoral commission
.
.
Voting Results for Committee.
.
.
.
.
.
.
.
.
.
.
.
.
.
.
.
.
.
No.
Name
No. of entitled
to vote
No. of ballot papers
issued
No. of votes
No. of votes: per list / valid [%]
total
valid
per List
321101
Dobra (Szczecińska), gm.
8228
3549
3543
3485
1529
43.87
321102
Kołbaskowo, gm.
6189
2127
2123
2078
757
36.43
321103
Nowe Warpno, gm.
1349
412
412
393
165
41.98
321104
Police, gm.
31898
11531
11526
11145
3780
33.92
policki, pow.
47664
17619
17604
17101
6231
36.44
.
.
Voting Results for Candidates
.
.
.
.
.
.
.
.
.
.
.
.
.
.
.
No.
Surname Names
No. of votes
% No. of votes per candidate/No. per list
% No. of votes per candidate/No. of valid votes
1
ZAREMBA Krzysztof Piotr
1237
19.85
7.23
2
NITRAS Sławomir Witold
928
14.89
5.43
3
KOCHAN Magdalena Maria
238
3.81
1.39
4
BUWELSKI Aleksander Antoni
32
0.51
0.19
5
SZABAŁKIN Maciej Krystian
36
0.57
0.21
6
URBAN Cezary
286
4.58
1.67
7
LITWIŃSKI Arkadiusz
470
7.54
2.75
8
ŁĄCKI Artur Jarosław
22
0.35
0.13
9
GUŹDZIOŁ Leszek Tomasz
598
9.59
3.50
10
LEWANDOWSKI Piotr Adam
75
1.20
0.44
11
TOŁOCZKO Wiktor
26
0.41
0.15
12
SZUMIŁOWICZ Igor Jarosław
44
0.70
0.26
13
KURSZEWSKA Irena Helena
58
0.93
0.34
14
DORNIAK Roman
7
0.11
0.04
15
MITRĘGA Stanisław
9
0.14
0.05
16
ZACHARCZUK Iwona Anna
30
0.48
0.18
17
GEBLEWICZ Olgierd Tomasz
10
0.16
0.06
18
CHOJANKOWSKI Arkadiusz
17
0.27
0.10
19
CHMIELEWSKA Ewa Anna
1545
24.79
9.03
20
HARMACIŃSKA Anna Teresa
25
0.40
0.15
21
BORZYMOWICZ Jacek Tomasz
10
0.16
0.06
22
SOLA Ryszard
11
0.17
0.06
23
MLECZKO Andrzej Józef
58
0.93
0.34
24
SKRZYPEK Rafał Sebastian
23
0.36
0.13
25
ZIENKIEWICZ Jacek Artur
37
0.59
0.22
26
MUSZYŃSKI Piotr
399
6.40
2.33
Σ
6231
100.00
36.43
.
.
Voting Results by location of ward electoral commission.
.
.
.
.
.
.
.
.
.
.
.
.
.
.
.
.
.
No.
Name
No. of entitled
to vote
No. of ballot
papers issued
No. of votes
No. of votes: per list / valid [%]
total
valid
per List
1
City
27662
10161
10157
9826
3353
34.12
2
Country
20002
7458
7447
7275
2878
39.56
.
Voting Results by number of inhabitants of commune
.
1
to 5 000
1349
412
412
393
165
41.98
2
from 5 001 to 10 000
6189
2127
2123
2078
757
36.43
3
from 10 001 to 20 000
8228
3549
3543
3485
1529
43.87
4
from 20 001 to 50 000
31898
11531
11526
11145
3780
33.92
5
from 50 001 to 100 000
0
0
0
0
0
0.00
6
from 100 001 to 200 000
0
0
0
0
0
0.00
7
from 200 001 to 500 000
0
0
0
0
0
0.00
8
over 500 000
0
0
0
0
0
0.00
Legal Acts
Documents
Electoral Bodies
Election Committees
Turnout
Results
Statistical Data
SENATE
PRESIDENT
Created by
Copyright [c] 2005
Mikrobit Sp. z o.o.
. All Rights Reserved.
top