.
.
Legal Acts
Documents
Electoral Bodies
Election Committees
Turnout
Results
Statistical Data
SENATE
PRESIDENT
Created by
.
.
Voting Results
.
.
.
Voting Results for Committee
.
.
.
.
.
.
.
.
.
.
.
.
.
.
.
.
.
.
.
.
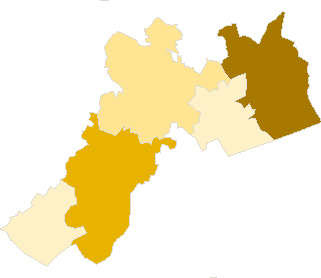
Polska
/
Szczecin
/
myśliborski, pow.
...
Komitet Wyborczy Platforma Obywatelska RP
List's Number:
8
No. of valid votes:
16250
No. of votes per List:
3398
20.91%
lack
14.25%
15.29%
16.33%
17.37%
18.41%
19.45%
20.49%
21.53%
22.57%
23.61%
not
.
.
.
.
.
.
.
.
.
.
.
.
of data
15.28%
16.32%
17.36%
18.40%
19.44%
20.48%
21.52%
22.56%
23.60%
24.65%
applicable
See also:
Turnout
Votes per Lists
Votes per Candidates
Information about Election Committee
Election results
Voting Results by location of ward electoral commission
.
.
Voting Results for Committee.
.
.
.
.
.
.
.
.
.
.
.
.
.
.
.
.
.
No.
Name
No. of entitled
to vote
No. of ballot papers
issued
No. of votes
No. of votes: per list / valid [%]
total
valid
per List
321001
Barlinek, gm.
15626
5101
5101
4950
1216
24.57
321002
Boleszkowice, gm.
2225
565
565
540
77
14.26
321003
Dębno, gm.
16321
5364
5353
5164
1162
22.50
321004
Myślibórz, gm.
16814
5182
5176
4977
854
17.16
321005
Nowogródek Pomorski, gm.
2517
654
654
619
89
14.38
myśliborski, pow.
53503
16866
16849
16250
3398
20.91
.
.
Voting Results for Candidates
.
.
.
.
.
.
.
.
.
.
.
.
.
.
.
No.
Surname Names
No. of votes
% No. of votes per candidate/No. per list
% No. of votes per candidate/No. of valid votes
1
ZAREMBA Krzysztof Piotr
848
24.95
5.22
2
NITRAS Sławomir Witold
648
19.07
3.99
3
KOCHAN Magdalena Maria
201
5.91
1.24
4
BUWELSKI Aleksander Antoni
70
2.06
0.43
5
SZABAŁKIN Maciej Krystian
31
0.91
0.19
6
URBAN Cezary
68
2.00
0.42
7
LITWIŃSKI Arkadiusz
161
4.73
0.99
8
ŁĄCKI Artur Jarosław
54
1.58
0.33
9
GUŹDZIOŁ Leszek Tomasz
17
0.50
0.10
10
LEWANDOWSKI Piotr Adam
86
2.53
0.53
11
TOŁOCZKO Wiktor
97
2.85
0.60
12
SZUMIŁOWICZ Igor Jarosław
41
1.20
0.25
13
KURSZEWSKA Irena Helena
62
1.82
0.38
14
DORNIAK Roman
33
0.97
0.20
15
MITRĘGA Stanisław
581
17.09
3.58
16
ZACHARCZUK Iwona Anna
34
1.00
0.21
17
GEBLEWICZ Olgierd Tomasz
10
0.29
0.06
18
CHOJANKOWSKI Arkadiusz
20
0.58
0.12
19
CHMIELEWSKA Ewa Anna
88
2.58
0.54
20
HARMACIŃSKA Anna Teresa
21
0.61
0.13
21
BORZYMOWICZ Jacek Tomasz
11
0.32
0.07
22
SOLA Ryszard
17
0.50
0.10
23
MLECZKO Andrzej Józef
40
1.17
0.25
24
SKRZYPEK Rafał Sebastian
17
0.50
0.10
25
ZIENKIEWICZ Jacek Artur
31
0.91
0.19
26
MUSZYŃSKI Piotr
111
3.26
0.68
Σ
3398
100.00
20.91
.
.
Voting Results by location of ward electoral commission.
.
.
.
.
.
.
.
.
.
.
.
.
.
.
.
.
.
No.
Name
No. of entitled
to vote
No. of ballot
papers issued
No. of votes
No. of votes: per list / valid [%]
total
valid
per List
1
City
33149
11615
11609
11244
2661
23.67
2
Country
20354
5251
5240
5006
737
14.72
.
Voting Results by number of inhabitants of commune
.
1
to 5 000
4742
1219
1219
1159
166
14.32
2
from 5 001 to 10 000
0
0
0
0
0
0.00
3
from 10 001 to 20 000
15626
5101
5101
4950
1216
24.57
4
from 20 001 to 50 000
33135
10546
10529
10141
2016
19.88
5
from 50 001 to 100 000
0
0
0
0
0
0.00
6
from 100 001 to 200 000
0
0
0
0
0
0.00
7
from 200 001 to 500 000
0
0
0
0
0
0.00
8
over 500 000
0
0
0
0
0
0.00
Legal Acts
Documents
Electoral Bodies
Election Committees
Turnout
Results
Statistical Data
SENATE
PRESIDENT
Created by
Copyright [c] 2005
Mikrobit Sp. z o.o.
. All Rights Reserved.
top