.
.
Legal Acts
Documents
Electoral Bodies
Election Committees
Turnout
Results
Statistical Data
SENATE
PRESIDENT
Created by
.
.
Voting Results
.
.
.
Voting Results for Committee
.
.
.
.
.
.
.
.
.
.
.
.
.
.
.
.
.
.
.
.
Polska
/
Kielce
/
skarżyski, pow.
...
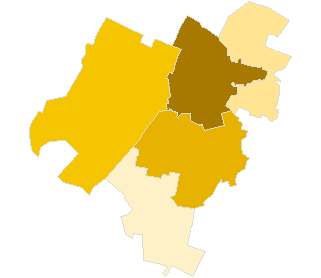
Komitet Wyborczy Platforma Obywatelska RP
List's Number:
8
No. of valid votes:
25015
No. of votes per List:
5246
20.97%
lack
4.73%
6.74%
8.75%
10.76%
12.77%
14.78%
16.79%
18.80%
20.81%
22.82%
not
.
.
.
.
.
.
.
.
.
.
.
.
of data
6.73%
8.74%
10.75%
12.76%
14.77%
16.78%
18.79%
20.80%
22.81%
24.83%
applicable
See also:
Turnout
Votes per Lists
Votes per Candidates
Information about Election Committee
Election results
Voting Results by location of ward electoral commission
.
.
Voting Results for Committee.
.
.
.
.
.
.
.
.
.
.
.
.
.
.
.
.
.
No.
Name
No. of entitled
to vote
No. of ballot papers
issued
No. of votes
No. of votes: per list / valid [%]
total
valid
per List
261002
Bliżyn, gm.
7042
2187
2185
2091
374
17.89
261003
Łączna, gm.
4113
1763
1763
1688
80
4.74
261004
Skarżysko Kościelne, gm.
5099
2082
2082
1958
203
10.37
261001
Skarżysko-Kamienna, m.
42409
16781
16761
16167
4004
24.77
261005
Suchedniów, gm.
9029
3219
3216
3111
585
18.80
skarżyski, pow.
67692
26032
26007
25015
5246
20.97
.
.
Voting Results for Candidates
.
.
.
.
.
.
.
.
.
.
.
.
.
.
.
No.
Surname Names
No. of votes
% No. of votes per candidate/No. per list
% No. of votes per candidate/No. of valid votes
1
MIODOWICZ Konstanty
964
18.37
3.85
2
GRZEGOREK Krzysztof Józef
3217
61.32
12.86
3
CICHY Ryszard
83
1.58
0.33
4
WRZAŁKA Zdzisław
43
0.81
0.17
5
SZREK Stanisław Zdzisław
98
1.86
0.39
6
RADLAK Sławomir
25
0.47
0.10
7
CICHOCKI Michał Ryszard
78
1.48
0.31
8
LESIAKOWSKI Tadeusz Jan
14
0.26
0.06
9
CURYŁO-MACHOWSKA Małgorzata
33
0.62
0.13
10
NIZIAŁEK Ryszard Waldemar
8
0.15
0.03
11
PIKULSKI Mieczysław
5
0.09
0.02
12
KLIMEK Barbara Genowefa
24
0.45
0.10
13
MIERZYŃSKI Janusz Ludwik
14
0.26
0.06
14
CHRABĄSZCZ Paweł Marek
17
0.32
0.07
15
JOPEK Sebastian
18
0.34
0.07
16
ZAPAŁA Katarzyna
60
1.14
0.24
17
BERA Rafał Mariusz
12
0.22
0.05
18
CIEŚLAK Janusz Andrzej
19
0.36
0.08
19
DOBROWOLSKI Rafał Michał
33
0.62
0.13
20
GĄGOROWSKI Paweł
18
0.34
0.07
21
KRÓL Małgorzata Teresa
34
0.64
0.14
22
MAJKA Ireneusz
11
0.20
0.04
23
MARCZEWSKA Marzena Anna
35
0.66
0.14
24
PACELT Zbigniew
98
1.86
0.39
25
PYTLIK Małgorzata
19
0.36
0.08
26
SORBIAN Tomasz Grzegorz
17
0.32
0.07
27
ŚLUSARCZYK Leszek
17
0.32
0.07
28
TALAGA Adam
90
1.71
0.36
29
WALENDZIK Grzegorz Marcin
37
0.70
0.15
30
WIŚNIEWSKA Jolanta Krystyna
27
0.51
0.11
31
WOŁOWIEC Jacek Marian
17
0.32
0.07
32
ZIOŁO Zbigniew
61
1.16
0.24
Σ
5246
100.00
20.97
.
.
Voting Results by location of ward electoral commission.
.
.
.
.
.
.
.
.
.
.
.
.
.
.
.
.
.
No.
Name
No. of entitled
to vote
No. of ballot
papers issued
No. of votes
No. of votes: per list / valid [%]
total
valid
per List
1
City
49864
19494
19471
18794
4521
24.06
2
Country
17828
6538
6536
6221
725
11.65
.
Voting Results by number of inhabitants of commune
.
1
to 5 000
0
0
0
0
0
0.00
2
from 5 001 to 10 000
16254
6032
6030
5737
657
11.45
3
from 10 001 to 20 000
9029
3219
3216
3111
585
18.80
4
from 20 001 to 50 000
0
0
0
0
0
0.00
5
from 50 001 to 100 000
42409
16781
16761
16167
4004
24.77
6
from 100 001 to 200 000
0
0
0
0
0
0.00
7
from 200 001 to 500 000
0
0
0
0
0
0.00
8
over 500 000
0
0
0
0
0
0.00
Legal Acts
Documents
Electoral Bodies
Election Committees
Turnout
Results
Statistical Data
SENATE
PRESIDENT
Created by
Copyright [c] 2005
Mikrobit Sp. z o.o.
. All Rights Reserved.
top