.
.
Legal Acts
Documents
Electoral Bodies
Election Committees
Turnout
Results
Statistical Data
SENATE
PRESIDENT
Created by
.
.
Voting Results
.
.
.
Voting Results for Committee
.
.
.
.
.
.
.
.
.
.
.
.
.
.
.
.
.
.
.
.
Polska
/
Kielce
/
ostrowiecki, pow.
...
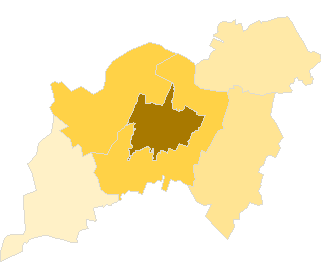
Komitet Wyborczy Platforma Obywatelska RP
List's Number:
8
No. of valid votes:
31314
No. of votes per List:
5549
17.72%
lack
3.23%
5.04%
6.85%
8.66%
10.47%
12.28%
14.09%
15.90%
17.71%
19.52%
not
.
.
.
.
.
.
.
.
.
.
.
.
of data
5.03%
6.84%
8.65%
10.46%
12.27%
14.08%
15.89%
17.70%
19.51%
21.33%
applicable
See also:
Turnout
Votes per Lists
Votes per Candidates
Information about Election Committee
Election results
Voting Results by location of ward electoral commission
.
.
Voting Results for Committee.
.
.
.
.
.
.
.
.
.
.
.
.
.
.
.
.
.
No.
Name
No. of entitled
to vote
No. of ballot papers
issued
No. of votes
No. of votes: per list / valid [%]
total
valid
per List
260702
Bałtów, gm.
3136
828
828
784
46
5.87
260703
Bodzechów, gm.
10810
3675
3640
3488
469
13.45
260704
Ćmielów, gm.
6525
2032
2031
1938
143
7.38
260705
Kunów, gm.
8023
2131
2105
2017
274
13.58
260701
Ostrowiec Świętokrzyski, m.
62983
22276
22270
21449
4564
21.28
260706
Waśniów, gm.
5660
1708
1708
1638
53
3.24
ostrowiecki, pow.
97137
32650
32582
31314
5549
17.72
.
.
Voting Results for Candidates
.
.
.
.
.
.
.
.
.
.
.
.
.
.
.
No.
Surname Names
No. of votes
% No. of votes per candidate/No. per list
% No. of votes per candidate/No. of valid votes
1
MIODOWICZ Konstanty
643
11.58
2.05
2
GRZEGOREK Krzysztof Józef
204
3.67
0.65
3
CICHY Ryszard
52
0.93
0.17
4
WRZAŁKA Zdzisław
14
0.25
0.04
5
SZREK Stanisław Zdzisław
108
1.94
0.34
6
RADLAK Sławomir
868
15.64
2.77
7
CICHOCKI Michał Ryszard
28
0.50
0.09
8
LESIAKOWSKI Tadeusz Jan
15
0.27
0.05
9
CURYŁO-MACHOWSKA Małgorzata
92
1.65
0.29
10
NIZIAŁEK Ryszard Waldemar
16
0.28
0.05
11
PIKULSKI Mieczysław
5
0.09
0.02
12
KLIMEK Barbara Genowefa
29
0.52
0.09
13
MIERZYŃSKI Janusz Ludwik
11
0.19
0.04
14
CHRABĄSZCZ Paweł Marek
8
0.14
0.03
15
JOPEK Sebastian
24
0.43
0.08
16
ZAPAŁA Katarzyna
39
0.70
0.12
17
BERA Rafał Mariusz
15
0.27
0.05
18
CIEŚLAK Janusz Andrzej
20
0.36
0.06
19
DOBROWOLSKI Rafał Michał
62
1.11
0.20
20
GĄGOROWSKI Paweł
17
0.30
0.05
21
KRÓL Małgorzata Teresa
44
0.79
0.14
22
MAJKA Ireneusz
8
0.14
0.03
23
MARCZEWSKA Marzena Anna
32
0.57
0.10
24
PACELT Zbigniew
2995
53.97
9.56
25
PYTLIK Małgorzata
13
0.23
0.04
26
SORBIAN Tomasz Grzegorz
2
0.03
0.01
27
ŚLUSARCZYK Leszek
8
0.14
0.03
28
TALAGA Adam
4
0.07
0.01
29
WALENDZIK Grzegorz Marcin
23
0.41
0.07
30
WIŚNIEWSKA Jolanta Krystyna
84
1.51
0.27
31
WOŁOWIEC Jacek Marian
7
0.12
0.02
32
ZIOŁO Zbigniew
59
1.06
0.19
Σ
5549
100.00
17.72
.
.
Voting Results by location of ward electoral commission.
.
.
.
.
.
.
.
.
.
.
.
.
.
.
.
.
.
No.
Name
No. of entitled
to vote
No. of ballot
papers issued
No. of votes
No. of votes: per list / valid [%]
total
valid
per List
1
City
69444
24112
24091
23182
4743
20.46
2
Country
27693
8538
8491
8132
806
9.91
.
Voting Results by number of inhabitants of commune
.
1
to 5 000
3136
828
828
784
46
5.87
2
from 5 001 to 10 000
12185
3740
3739
3576
196
5.48
3
from 10 001 to 20 000
18833
5806
5745
5505
743
13.50
4
from 20 001 to 50 000
0
0
0
0
0
0.00
5
from 50 001 to 100 000
62983
22276
22270
21449
4564
21.28
6
from 100 001 to 200 000
0
0
0
0
0
0.00
7
from 200 001 to 500 000
0
0
0
0
0
0.00
8
over 500 000
0
0
0
0
0
0.00
Legal Acts
Documents
Electoral Bodies
Election Committees
Turnout
Results
Statistical Data
SENATE
PRESIDENT
Created by
Copyright [c] 2005
Mikrobit Sp. z o.o.
. All Rights Reserved.
top