.
.
Legal Acts
Documents
Electoral Bodies
Election Committees
Turnout
Results
Statistical Data
SENATE
PRESIDENT
Created by
.
.
Voting Results
.
.
.
Voting Results for Committee
.
.
.
.
.
.
.
.
.
.
.
.
.
.
.
.
.
.
.
.
Polska
/
Gdańsk
/
sztumski, pow.
...
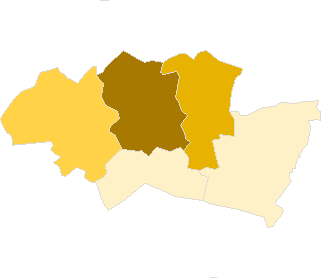
Komitet Wyborczy Platforma Obywatelska RP
List's Number:
8
No. of valid votes:
9966
No. of votes per List:
2885
28.95%
lack
13.85%
16.28%
18.71%
21.14%
23.57%
26.00%
28.43%
30.86%
33.29%
35.72%
not
.
.
.
.
.
.
.
.
.
.
.
.
of data
16.27%
18.70%
21.13%
23.56%
25.99%
28.42%
30.85%
33.28%
35.71%
38.15%
applicable
See also:
Turnout
Votes per Lists
Votes per Candidates
Information about Election Committee
Election results
Voting Results by location of ward electoral commission
.
.
Voting Results for Committee.
.
.
.
.
.
.
.
.
.
.
.
.
.
.
.
.
.
No.
Name
No. of entitled
to vote
No. of ballot papers
issued
No. of votes
No. of votes: per list / valid [%]
total
valid
per List
221601
Dzierzgoń, gm.
7365
2445
2444
2263
723
31.95
221602
Mikołajki Pomorskie, gm.
2817
619
618
568
89
15.67
221603
Stary Dzierzgoń, gm.
3247
605
603
563
78
13.85
221604
Stary Targ, gm.
4984
1533
1533
1435
547
38.12
221605
Sztum, gm.
15497
5336
5334
5137
1448
28.19
sztumski, pow.
33910
10538
10532
9966
2885
28.95
.
.
Voting Results for Candidates
.
.
.
.
.
.
.
.
.
.
.
.
.
.
.
No.
Surname Names
No. of votes
% No. of votes per candidate/No. per list
% No. of votes per candidate/No. of valid votes
1
TUSK Donald Franciszek
1550
53.72
15.55
2
NOWAK Sławomir Ryszard
42
1.45
0.42
3
ZIELIŃSKA-GŁĘBOCKA Anna Maria
40
1.38
0.40
4
RYBICKI Arkadiusz Czesław
47
1.62
0.47
5
MODRZEJEWSKI Marek Bogusław
25
0.86
0.25
6
KOZDROŃ Jerzy
123
4.26
1.23
7
NEUMANN Sławomir Arkadiusz
15
0.51
0.15
8
BIENIASZ-KRZYWIEC Cezary Czesław
11
0.38
0.11
9
PIÓRKOWSKI Zbigniew Jan
8
0.27
0.08
10
CEGIELSKI Dariusz Stanisław
86
2.98
0.86
11
SKOLIMOWSKA Teresa
404
14.00
4.05
12
PRUŚ Sylwester Zbigniew
3
0.10
0.03
13
RYCHŁOWSKI Andrzej Sławomir
39
1.35
0.39
14
PIŁAT Patryk Piotr
2
0.06
0.02
15
MARCHLEWSKA Katarzyna Dorota
4
0.13
0.04
16
HLOUSEK Jerzy Zbigniew
3
0.10
0.03
17
WIERZBA Beata Małgorzata
8
0.27
0.08
18
STYSIAK Paweł Leon
4
0.13
0.04
19
SOBCZYŃSKA Małgorzata Helena
16
0.55
0.16
20
PEĆ Mirosław
318
11.02
3.19
21
POSADZY Mirosław Andrzej
0
0.00
0.00
22
ŁAGOWSKI Janusz Roman
2
0.06
0.02
23
ADAMSKI Jerzy Waldemar
8
0.27
0.08
24
WAŁĘSA Jarosław Leszek
127
4.40
1.27
Σ
2885
100.00
28.94
.
.
Voting Results by location of ward electoral commission.
.
.
.
.
.
.
.
.
.
.
.
.
.
.
.
.
.
No.
Name
No. of entitled
to vote
No. of ballot
papers issued
No. of votes
No. of votes: per list / valid [%]
total
valid
per List
1
City
15367
5701
5698
5423
1688
31.13
2
Country
18543
4837
4834
4543
1197
26.35
.
Voting Results by number of inhabitants of commune
.
1
to 5 000
6064
1224
1221
1131
167
14.77
2
from 5 001 to 10 000
12349
3978
3977
3698
1270
34.34
3
from 10 001 to 20 000
15497
5336
5334
5137
1448
28.19
4
from 20 001 to 50 000
0
0
0
0
0
0.00
5
from 50 001 to 100 000
0
0
0
0
0
0.00
6
from 100 001 to 200 000
0
0
0
0
0
0.00
7
from 200 001 to 500 000
0
0
0
0
0
0.00
8
over 500 000
0
0
0
0
0
0.00
Legal Acts
Documents
Electoral Bodies
Election Committees
Turnout
Results
Statistical Data
SENATE
PRESIDENT
Created by
Copyright [c] 2005
Mikrobit Sp. z o.o.
. All Rights Reserved.
top