.
.
Legal Acts
Documents
Electoral Bodies
Election Committees
Turnout
Results
Statistical Data
SENATE
PRESIDENT
Created by
.
.
Voting Results
.
.
.
Voting Results for Committee
.
.
.
.
.
.
.
.
.
.
.
.
.
.
.
.
.
.
.
.
Polska
/
Gdańsk
/
nowodworski, pow.
...
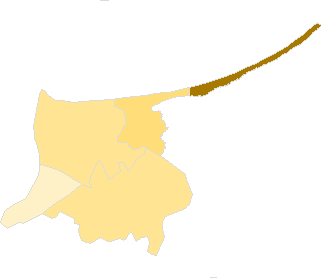
Komitet Wyborczy Platforma Obywatelska RP
List's Number:
8
No. of valid votes:
8722
No. of votes per List:
2207
25.30%
lack
17.54%
20.32%
23.10%
25.88%
28.66%
31.44%
34.22%
37.00%
39.78%
42.56%
not
.
.
.
.
.
.
.
.
.
.
.
.
of data
20.31%
23.09%
25.87%
28.65%
31.43%
34.21%
36.99%
39.77%
42.55%
45.34%
applicable
See also:
Turnout
Votes per Lists
Votes per Candidates
Information about Election Committee
Election results
Voting Results by location of ward electoral commission
.
.
Voting Results for Committee.
.
.
.
.
.
.
.
.
.
.
.
.
.
.
.
.
.
No.
Name
No. of entitled
to vote
No. of ballot papers
issued
No. of votes
No. of votes: per list / valid [%]
total
valid
per List
221001
Krynica Morska, m.
1152
418
418
406
184
45.32
221002
Nowy Dwór Gdański, gm.
14047
4542
4541
4357
1071
24.58
221003
Ostaszewo, gm.
2478
832
832
798
140
17.54
221004
Stegna, gm.
7691
2376
2376
2262
579
25.60
221005
Sztutowo, gm.
2859
1001
1001
899
233
25.92
nowodworski, pow.
28227
9169
9168
8722
2207
25.30
.
.
Voting Results for Candidates
.
.
.
.
.
.
.
.
.
.
.
.
.
.
.
No.
Surname Names
No. of votes
% No. of votes per candidate/No. per list
% No. of votes per candidate/No. of valid votes
1
TUSK Donald Franciszek
1439
65.20
16.50
2
NOWAK Sławomir Ryszard
86
3.89
0.99
3
ZIELIŃSKA-GŁĘBOCKA Anna Maria
32
1.44
0.37
4
RYBICKI Arkadiusz Czesław
42
1.90
0.48
5
MODRZEJEWSKI Marek Bogusław
20
0.90
0.23
6
KOZDROŃ Jerzy
21
0.95
0.24
7
NEUMANN Sławomir Arkadiusz
16
0.72
0.18
8
BIENIASZ-KRZYWIEC Cezary Czesław
9
0.40
0.10
9
PIÓRKOWSKI Zbigniew Jan
216
9.78
2.48
10
CEGIELSKI Dariusz Stanisław
89
4.03
1.02
11
SKOLIMOWSKA Teresa
29
1.31
0.33
12
PRUŚ Sylwester Zbigniew
4
0.18
0.05
13
RYCHŁOWSKI Andrzej Sławomir
5
0.22
0.06
14
PIŁAT Patryk Piotr
1
0.04
0.01
15
MARCHLEWSKA Katarzyna Dorota
9
0.40
0.10
16
HLOUSEK Jerzy Zbigniew
2
0.09
0.02
17
WIERZBA Beata Małgorzata
6
0.27
0.07
18
STYSIAK Paweł Leon
40
1.81
0.46
19
SOBCZYŃSKA Małgorzata Helena
23
1.04
0.26
20
PEĆ Mirosław
6
0.27
0.07
21
POSADZY Mirosław Andrzej
0
0.00
0.00
22
ŁAGOWSKI Janusz Roman
0
0.00
0.00
23
ADAMSKI Jerzy Waldemar
10
0.45
0.11
24
WAŁĘSA Jarosław Leszek
102
4.62
1.17
Σ
2207
100.00
25.30
.
.
Voting Results by location of ward electoral commission.
.
.
.
.
.
.
.
.
.
.
.
.
.
.
.
.
.
No.
Name
No. of entitled
to vote
No. of ballot
papers issued
No. of votes
No. of votes: per list / valid [%]
total
valid
per List
1
City
9875
3443
3443
3315
1031
31.10
2
Country
18352
5726
5725
5407
1176
21.75
.
Voting Results by number of inhabitants of commune
.
1
to 5 000
6489
2251
2251
2103
557
26.49
2
from 5 001 to 10 000
7691
2376
2376
2262
579
25.60
3
from 10 001 to 20 000
14047
4542
4541
4357
1071
24.58
4
from 20 001 to 50 000
0
0
0
0
0
0.00
5
from 50 001 to 100 000
0
0
0
0
0
0.00
6
from 100 001 to 200 000
0
0
0
0
0
0.00
7
from 200 001 to 500 000
0
0
0
0
0
0.00
8
over 500 000
0
0
0
0
0
0.00
Legal Acts
Documents
Electoral Bodies
Election Committees
Turnout
Results
Statistical Data
SENATE
PRESIDENT
Created by
Copyright [c] 2005
Mikrobit Sp. z o.o.
. All Rights Reserved.
top