.
.
Legal Acts
Documents
Electoral Bodies
Election Committees
Turnout
Results
Statistical Data
SENATE
PRESIDENT
Created by
.
.
Voting Results
.
.
.
Voting Results for Committee
.
.
.
.
.
.
.
.
.
.
.
.
.
.
.
.
.
.
.
.
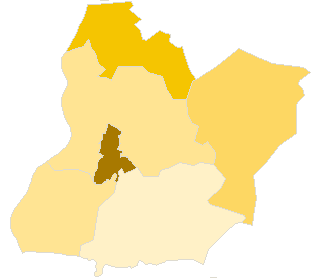
Polska
/
Gdańsk
/
kwidzyński, pow.
...
Komitet Wyborczy Platforma Obywatelska RP
List's Number:
8
No. of valid votes:
20064
No. of votes per List:
6440
32.10%
lack
16.26%
18.50%
20.74%
22.98%
25.22%
27.46%
29.70%
31.94%
34.18%
36.42%
not
.
.
.
.
.
.
.
.
.
.
.
.
of data
18.49%
20.73%
22.97%
25.21%
27.45%
29.69%
31.93%
34.17%
36.41%
38.66%
applicable
See also:
Turnout
Votes per Lists
Votes per Candidates
Information about Election Committee
Election results
Voting Results by location of ward electoral commission
.
.
Voting Results for Committee.
.
.
.
.
.
.
.
.
.
.
.
.
.
.
.
.
.
No.
Name
No. of entitled
to vote
No. of ballot papers
issued
No. of votes
No. of votes: per list / valid [%]
total
valid
per List
220702
Gardeja, gm.
6204
1587
1564
1494
243
16.27
220703
Kwidzyn, gm.
7632
2203
2202
2104
461
21.91
220701
Kwidzyn, m.
30079
11893
11889
11541
4461
38.65
220704
Prabuty, gm.
10325
2852
2849
2742
692
25.24
220705
Ryjewo, gm.
4222
1249
1249
1143
350
30.62
220706
Sadlinki, gm.
4077
1081
1081
1040
233
22.40
kwidzyński, pow.
62539
20865
20834
20064
6440
32.10
.
.
Voting Results for Candidates
.
.
.
.
.
.
.
.
.
.
.
.
.
.
.
No.
Surname Names
No. of votes
% No. of votes per candidate/No. per list
% No. of votes per candidate/No. of valid votes
1
TUSK Donald Franciszek
2352
36.52
11.72
2
NOWAK Sławomir Ryszard
61
0.94
0.30
3
ZIELIŃSKA-GŁĘBOCKA Anna Maria
54
0.83
0.27
4
RYBICKI Arkadiusz Czesław
62
0.96
0.31
5
MODRZEJEWSKI Marek Bogusław
13
0.20
0.06
6
KOZDROŃ Jerzy
3429
53.24
17.09
7
NEUMANN Sławomir Arkadiusz
15
0.23
0.07
8
BIENIASZ-KRZYWIEC Cezary Czesław
8
0.12
0.04
9
PIÓRKOWSKI Zbigniew Jan
10
0.15
0.05
10
CEGIELSKI Dariusz Stanisław
55
0.85
0.27
11
SKOLIMOWSKA Teresa
35
0.54
0.17
12
PRUŚ Sylwester Zbigniew
2
0.03
0.01
13
RYCHŁOWSKI Andrzej Sławomir
10
0.15
0.05
14
PIŁAT Patryk Piotr
14
0.21
0.07
15
MARCHLEWSKA Katarzyna Dorota
11
0.17
0.05
16
HLOUSEK Jerzy Zbigniew
6
0.09
0.03
17
WIERZBA Beata Małgorzata
26
0.40
0.13
18
STYSIAK Paweł Leon
4
0.06
0.02
19
SOBCZYŃSKA Małgorzata Helena
106
1.64
0.53
20
PEĆ Mirosław
3
0.04
0.01
21
POSADZY Mirosław Andrzej
0
0.00
0.00
22
ŁAGOWSKI Janusz Roman
4
0.06
0.02
23
ADAMSKI Jerzy Waldemar
10
0.15
0.05
24
WAŁĘSA Jarosław Leszek
150
2.32
0.75
Σ
6440
100.00
32.09
.
.
Voting Results by location of ward electoral commission.
.
.
.
.
.
.
.
.
.
.
.
.
.
.
.
.
.
No.
Name
No. of entitled
to vote
No. of ballot
papers issued
No. of votes
No. of votes: per list / valid [%]
total
valid
per List
1
City
37491
14064
14057
13630
5071
37.20
2
Country
25048
6801
6777
6434
1369
21.28
.
Voting Results by number of inhabitants of commune
.
1
to 5 000
0
0
0
0
0
0.00
2
from 5 001 to 10 000
14503
3917
3894
3677
826
22.46
3
from 10 001 to 20 000
17957
5055
5051
4846
1153
23.79
4
from 20 001 to 50 000
30079
11893
11889
11541
4461
38.65
5
from 50 001 to 100 000
0
0
0
0
0
0.00
6
from 100 001 to 200 000
0
0
0
0
0
0.00
7
from 200 001 to 500 000
0
0
0
0
0
0.00
8
over 500 000
0
0
0
0
0
0.00
Legal Acts
Documents
Electoral Bodies
Election Committees
Turnout
Results
Statistical Data
SENATE
PRESIDENT
Created by
Copyright [c] 2005
Mikrobit Sp. z o.o.
. All Rights Reserved.
top