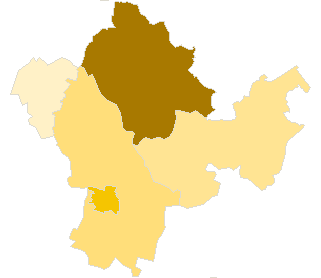
.
.
Legal Acts
Documents
Electoral Bodies
Election Committees
Turnout
Results
Statistical Data
SENATE
PRESIDENT
Created by
.
.
Voting Results
.
.
.
Voting Results for Committee
.
.
.
.
.
.
.
.
.
.
.
.
.
.
.
.
.
.
.
.
Polska
/
Gdynia
/
chojnicki, pow.
...
Komitet Wyborczy Platforma Obywatelska RP
List's Number:
8
No. of valid votes:
27465
No. of votes per List:
6262
22.80%
lack
9.96%
12.18%
14.40%
16.62%
18.84%
21.06%
23.28%
25.50%
27.72%
29.94%
not
.
.
.
.
.
.
.
.
.
.
.
.
of data
12.17%
14.39%
16.61%
18.83%
21.05%
23.27%
25.49%
27.71%
29.93%
32.16%
applicable
See also:
Turnout
Votes per Lists
Votes per Candidates
Information about Election Committee
Election results
Voting Results by location of ward electoral commission
.
.
Voting Results for Committee.
.
.
.
.
.
.
.
.
.
.
.
.
.
.
.
.
.
No.
Name
No. of entitled
to vote
No. of ballot papers
issued
No. of votes
No. of votes: per list / valid [%]
total
valid
per List
220202
Brusy, gm.
9816
4863
4863
4681
1504
32.13
220203
Chojnice, gm.
11627
4205
4205
4006
677
16.90
220201
Chojnice, m.
31732
12989
12983
12559
3185
25.36
220204
Czersk, gm.
15617
5819
5816
5577
832
14.92
220205
Konarzyny, gm.
1604
660
660
642
64
9.97
chojnicki, pow.
70396
28536
28527
27465
6262
22.80
.
.
Voting Results for Candidates
.
.
.
.
.
.
.
.
.
.
.
.
.
.
.
No.
Surname Names
No. of votes
% No. of votes per candidate/No. per list
% No. of votes per candidate/No. of valid votes
1
BIERNACKI Marek
1893
30.22
6.89
2
AZIEWICZ Tadeusz
48
0.76
0.17
3
KLEINA Kazimierz Mariusz
154
2.45
0.56
4
PLOCKE Kazimierz Florian
22
0.35
0.08
5
BUDNIK Jerzy Feliks
41
0.65
0.15
6
KUMIK Ewa Barbara
89
1.42
0.32
7
ZABOROWSKI Roman
65
1.03
0.24
8
CYRZAN Grzegorz Piotr
122
1.94
0.44
9
STRZYŻEWICZ Ryszard Andrzej
15
0.23
0.05
10
LAMCZYK Stanisław Józef
1071
17.10
3.90
11
JUCHNIEWICZ Katarzyna Jadwiga
69
1.10
0.25
12
SZCZEPAŃSKI Marek
1081
17.26
3.94
13
KUBALEWSKI Arkadiusz Piotr
24
0.38
0.09
14
MIOTK Zyta Maria
42
0.67
0.15
15
KONWIŃSKI Zbigniew Marek
18
0.28
0.07
16
BAGNECKI Jacek Piotr
11
0.17
0.04
17
CZARNOWSKI Marek
1060
16.92
3.86
18
ZIELIŃSKA Joanna Violetta
94
1.50
0.34
19
MODRZEJEWSKI Józef
73
1.16
0.27
20
LISOWSKA Bożenna
62
0.99
0.23
21
GEMBAL Robert Andrzej
16
0.25
0.06
22
MAZUR Henryka Anna
28
0.44
0.10
23
ZALAS Krystian Tomasz
12
0.19
0.04
24
RADZIMIŃSKI Szymon Marian
37
0.59
0.13
25
MARZEC Ireneusz Wiesław
12
0.19
0.04
26
MARCZAK Marcin
20
0.31
0.07
27
CHROŚCICKA Anna Maria
42
0.67
0.15
28
MŁYŃSKI Piotr Jerzy
41
0.65
0.15
Σ
6262
100.00
22.79
.
.
Voting Results by location of ward electoral commission.
.
.
.
.
.
.
.
.
.
.
.
.
.
.
.
.
.
No.
Name
No. of entitled
to vote
No. of ballot
papers issued
No. of votes
No. of votes: per list / valid [%]
total
valid
per List
1
City
42456
17723
17715
17122
4467
26.09
2
Country
27940
10813
10812
10343
1795
17.35
.
Voting Results by number of inhabitants of commune
.
1
to 5 000
1604
660
660
642
64
9.97
2
from 5 001 to 10 000
0
0
0
0
0
0.00
3
from 10 001 to 20 000
21443
9068
9068
8687
2181
25.11
4
from 20 001 to 50 000
47349
18808
18799
18136
4017
22.15
5
from 50 001 to 100 000
0
0
0
0
0
0.00
6
from 100 001 to 200 000
0
0
0
0
0
0.00
7
from 200 001 to 500 000
0
0
0
0
0
0.00
8
over 500 000
0
0
0
0
0
0.00
Legal Acts
Documents
Electoral Bodies
Election Committees
Turnout
Results
Statistical Data
SENATE
PRESIDENT
Created by
Copyright [c] 2005
Mikrobit Sp. z o.o.
. All Rights Reserved.
top