.
.
 
. .
Voting Results
.
. . Voting Results for Committee . .
. .
. . . . . . . . . . . . . . . .
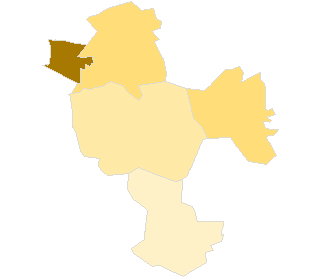
Polska / Lublin / świdnicki, pow. ...
Komitet Wyborczy Platforma Obywatelska RP
List's Number: 8
No. of valid votes: 22024
No. of votes per List: 3909
17.75%
lack4.13%6.01%7.89%9.77%11.65%13.53%15.41%17.29%19.17%21.05%not
............
of data6.00%7.88%9.76%11.64%13.52%15.40%17.28%19.16%21.04%22.93%applicable

See also:
. . Voting Results for Committee. . .
. .
. . . . . . . . . . . . .
No. Name No. of entitled
to vote
No. of ballot papers
issued
No. of votes No. of votes: per list / valid [%]
total valid per List
061702Mełgiew, gm.618622512251217923910.97
061703Piaski, gm.85132769276826842107.82
061704Rybczewice, gm.3281124712471162484.13
061701Świdnik, m.33209144311441514053321222.86
061705Trawniki, gm.726420742074194620010.28
  świdnicki, pow. 58453 22772 22755 22024 3909 17.75

. . Voting Results for Candidates . .
. .
. . . . . . . . . . .
No. Surname Names No. of votes % No. of votes per candidate/No. per list % No. of votes per candidate/No. of valid votes
1PALIKOT Janusz Marian146137.376.63
2KARPIŃSKI Włodzimierz1042.660.47
3JEDLINA Dariusz1904.860.86
4WILK Wojciech300.760.14
5BIAŁOWĄS Waldemar Franciszek112128.675.09
6TYMOSZUK Krzysztof120.300.05
7SOBCZAK Jacek2396.111.09
8ZALEWSKI Jacek Kazimierz170.430.08
9CIĘŻKI Paweł Sylwester180.460.08
10SOWIŃSKA Mariola1323.370.60
11ORZEŁ Grzegorz180.460.08
12KUŹNICKI Witold50.120.02
13ZIOMEK Mirosław370.940.17
14STROJNOWSKA Henryka180.460.08
15DZIKOWSKI Artur80.200.04
16KMITA Elżbieta Helena120.300.05
17BORKOWSKI Wojciech Stanisław3188.131.44
18PUDŁO Tadeusz110.280.05
19GAJAK Andrzej40.100.02
20PIOTR-KRAJECKI Leszek50.120.02
21ZBIRÓG Halina50.120.02
22FLASIŃSKI Marek20.050.01
23SIERPIŃSKA Marta Justyna230.580.10
24BIELECKA Elżbieta Maria130.330.06
25MARGUL Bartosz190.480.09
26DAJEK Dariusz Romuald50.120.02
27JABŁOŃSKI Adam180.460.08
28GWIAZDOWICZ Bogusław Piotr90.230.04
29DANIEWSKI Leszek Kazimierz250.630.11
30ŁĄTKA Krzysztof300.760.14
Σ   3909 100.00 17.74
 
. . Voting Results by location of ward electoral commission. . .
. .
. . . . . . . . . . . . .
No. Name No. of entitled
to vote
No. of ballot
papers issued
No. of votes No. of votes: per list / valid [%]
total valid per List
1City35349152791526314867332522.36
2Country231047493749271575848.16
. Voting Results by number of inhabitants of commune .
1to 5 0003281124712471162484.13
2from 5 001 to 10 0001345043254325412543910.64
3from 10 001 to 20 00085132769276826842107.82
4from 20 001 to 50 00033209144311441514053321222.86
5from 50 001 to 100 000000000.00 
6from 100 001 to 200 000000000.00 
7from 200 001 to 500 000000000.00 
8over 500 000000000.00 

  Legal Acts Documents Electoral Bodies Election Committees Turnout Results Statistical Data SENATE PRESIDENT Created by
 top