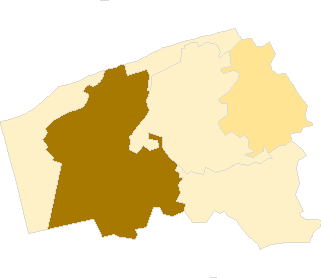
.
.
Legal Acts
Documents
Electoral Bodies
Election Committees
Turnout
Results
Statistical Data
SENATE
PRESIDENT
Created by
.
.
Voting Results
.
.
.
Voting Results for Committee
.
.
.
.
.
.
.
.
.
.
.
.
.
.
.
.
.
.
.
.
Polska
/
Szczecin
/
kamieński, pow.
...
Komitet Wyborczy Polskiego Stronnictwa Ludowego
List's Number:
10
No. of valid votes:
12656
No. of votes per List:
797
6.30%
lack
3.81%
4.71%
5.61%
6.51%
7.41%
8.31%
9.21%
10.11%
11.01%
11.91%
not
.
.
.
.
.
.
.
.
.
.
.
.
of data
4.70%
5.60%
6.50%
7.40%
8.30%
9.20%
10.10%
11.00%
11.90%
12.81%
applicable
See also:
Turnout
Votes per Lists
Votes per Candidates
Information about Election Committee
Election results
Voting Results by location of ward electoral commission
.
.
Voting Results for Committee.
.
.
.
.
.
.
.
.
.
.
.
.
.
.
.
.
.
No.
Name
No. of entitled
to vote
No. of ballot papers
issued
No. of votes
No. of votes: per list / valid [%]
total
valid
per List
320701
Dziwnów, gm.
3622
1368
1358
1325
57
4.30
320702
Golczewo, gm.
4751
1704
1703
1622
69
4.25
320703
Kamień Pomorski, gm.
12037
4205
4201
4081
183
4.48
320704
Międzyzdroje, gm.
5559
2100
2097
2017
77
3.82
320705
Świerzno, gm.
3245
787
787
746
46
6.17
320706
Wolin, gm.
9870
2990
2990
2865
365
12.74
kamieński, pow.
39084
13154
13136
12656
797
6.30
.
.
Voting Results for Candidates
.
.
.
.
.
.
.
.
.
.
.
.
.
.
.
No.
Surname Names
No. of votes
% No. of votes per candidate/No. per list
% No. of votes per candidate/No. of valid votes
1
ZIEMBA Kazimierz
68
8.53
0.54
2
DURSKI Grzegorz
9
1.12
0.07
3
BEKIER Ryszarda
12
1.50
0.09
4
SADŁOWSKI Edward Stanisław
16
2.00
0.13
5
DURKA Andrzej Zdzisław
30
3.76
0.24
6
KARŁOWSKI Michał
13
1.63
0.10
7
TRZOS Bogdan Wojciech
5
0.62
0.04
8
ZIELIŃSKA Aleksandra
21
2.63
0.17
9
WOŁEK Jan
42
5.26
0.33
10
BARANIAK Piotr Paweł
42
5.26
0.33
11
CHOCHOŁOWSKI Zbigniew Renold
28
3.51
0.22
12
WAWRZYNIAK Waldemar Marek
11
1.38
0.09
13
RUCIŃSKI Witold Florian
7
0.87
0.06
14
JASIEWICZ Eugeniusz
372
46.67
2.94
15
OŚCIŁOWSKI Jarosław
3
0.37
0.02
16
RUPENTHAL Andrzej
2
0.25
0.02
17
WEGNER Marek
0
0.00
0.00
18
GREŚ Damian Maciej
0
0.00
0.00
19
SZCZYPIÓR Leszek
0
0.00
0.00
20
KNOP Małgorzata Anna
5
0.62
0.04
21
KIJEWSKI Marian
0
0.00
0.00
22
BLADOSZEWSKI Andrzej Henryk
4
0.50
0.03
23
OŁTUSZEWSKI Piotr Paweł
3
0.37
0.02
24
NAWOROL Stefan Edward
1
0.12
0.01
25
POSŁUSZNY Andrzej Piotr
8
1.00
0.06
26
POMIECZYŃSKI Zbigniew Rajmund
95
11.91
0.75
Σ
797
100.00
6.29
.
.
Voting Results by location of ward electoral commission.
.
.
.
.
.
.
.
.
.
.
.
.
.
.
.
.
.
No.
Name
No. of entitled
to vote
No. of ballot
papers issued
No. of votes
No. of votes: per list / valid [%]
total
valid
per List
1
City
22048
8222
8206
7942
424
5.34
2
Country
17036
4932
4930
4714
373
7.91
.
Voting Results by number of inhabitants of commune
.
1
to 5 000
6867
2155
2145
2071
103
4.97
2
from 5 001 to 10 000
10310
3804
3800
3639
146
4.01
3
from 10 001 to 20 000
21907
7195
7191
6946
548
7.89
4
from 20 001 to 50 000
0
0
0
0
0
0.00
5
from 50 001 to 100 000
0
0
0
0
0
0.00
6
from 100 001 to 200 000
0
0
0
0
0
0.00
7
from 200 001 to 500 000
0
0
0
0
0
0.00
8
over 500 000
0
0
0
0
0
0.00
Legal Acts
Documents
Electoral Bodies
Election Committees
Turnout
Results
Statistical Data
SENATE
PRESIDENT
Created by
Copyright [c] 2005
Mikrobit Sp. z o.o.
. All Rights Reserved.
top