.
.
Legal Acts
Documents
Electoral Bodies
Election Committees
Turnout
Results
Statistical Data
SENATE
PRESIDENT
Created by
.
.
Voting Results
.
.
.
Voting Results for Committee
.
.
.
.
.
.
.
.
.
.
.
.
.
.
.
.
.
.
.
.
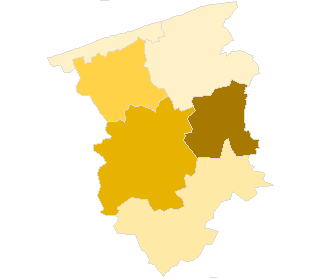
Polska
/
Szczecin
/
gryficki, pow.
...
Komitet Wyborczy Polskiego Stronnictwa Ludowego
List's Number:
10
No. of valid votes:
15421
No. of votes per List:
869
5.64%
lack
3.10%
3.69%
4.28%
4.87%
5.46%
6.05%
6.64%
7.23%
7.82%
8.41%
not
.
.
.
.
.
.
.
.
.
.
.
.
of data
3.68%
4.27%
4.86%
5.45%
6.04%
6.63%
7.22%
7.81%
8.40%
9.00%
applicable
See also:
Turnout
Votes per Lists
Votes per Candidates
Information about Election Committee
Election results
Voting Results by location of ward electoral commission
.
.
Voting Results for Committee.
.
.
.
.
.
.
.
.
.
.
.
.
.
.
.
.
.
No.
Name
No. of entitled
to vote
No. of ballot papers
issued
No. of votes
No. of votes: per list / valid [%]
total
valid
per List
320501
Brojce, gm.
2900
650
650
605
54
8.93
320502
Gryfice, gm.
19219
6674
6670
6427
498
7.75
320503
Karnice, gm.
3320
917
914
874
54
6.18
320504
Płoty, gm.
7253
2589
2589
2493
103
4.13
320507
Rewal, gm.
2912
1311
1310
1258
39
3.10
320508
Trzebiatów, gm.
13161
3989
3987
3764
121
3.21
gryficki, pow.
48765
16130
16120
15421
869
5.64
.
.
Voting Results for Candidates
.
.
.
.
.
.
.
.
.
.
.
.
.
.
.
No.
Surname Names
No. of votes
% No. of votes per candidate/No. per list
% No. of votes per candidate/No. of valid votes
1
ZIEMBA Kazimierz
69
7.94
0.45
2
DURSKI Grzegorz
7
0.80
0.05
3
BEKIER Ryszarda
6
0.69
0.04
4
SADŁOWSKI Edward Stanisław
11
1.26
0.07
5
DURKA Andrzej Zdzisław
31
3.56
0.20
6
KARŁOWSKI Michał
23
2.64
0.15
7
TRZOS Bogdan Wojciech
10
1.15
0.06
8
ZIELIŃSKA Aleksandra
22
2.53
0.14
9
WOŁEK Jan
53
6.09
0.34
10
BARANIAK Piotr Paweł
11
1.26
0.07
11
CHOCHOŁOWSKI Zbigniew Renold
2
0.23
0.01
12
WAWRZYNIAK Waldemar Marek
500
57.53
3.24
13
RUCIŃSKI Witold Florian
5
0.57
0.03
14
JASIEWICZ Eugeniusz
11
1.26
0.07
15
OŚCIŁOWSKI Jarosław
0
0.00
0.00
16
RUPENTHAL Andrzej
1
0.11
0.01
17
WEGNER Marek
4
0.46
0.03
18
GREŚ Damian Maciej
2
0.23
0.01
19
SZCZYPIÓR Leszek
2
0.23
0.01
20
KNOP Małgorzata Anna
23
2.64
0.15
21
KIJEWSKI Marian
61
7.01
0.40
22
BLADOSZEWSKI Andrzej Henryk
0
0.00
0.00
23
OŁTUSZEWSKI Piotr Paweł
1
0.11
0.01
24
NAWOROL Stefan Edward
1
0.11
0.01
25
POSŁUSZNY Andrzej Piotr
1
0.11
0.01
26
POMIECZYŃSKI Zbigniew Rajmund
12
1.38
0.08
Σ
869
100.00
5.63
.
.
Voting Results by location of ward electoral commission.
.
.
.
.
.
.
.
.
.
.
.
.
.
.
.
.
.
No.
Name
No. of entitled
to vote
No. of ballot
papers issued
No. of votes
No. of votes: per list / valid [%]
total
valid
per List
1
City
25015
9180
9174
8758
395
4.51
2
Country
23750
6950
6946
6663
474
7.11
.
Voting Results by number of inhabitants of commune
.
1
to 5 000
9132
2878
2874
2737
147
5.37
2
from 5 001 to 10 000
7253
2589
2589
2493
103
4.13
3
from 10 001 to 20 000
13161
3989
3987
3764
121
3.21
4
from 20 001 to 50 000
19219
6674
6670
6427
498
7.75
5
from 50 001 to 100 000
0
0
0
0
0
0.00
6
from 100 001 to 200 000
0
0
0
0
0
0.00
7
from 200 001 to 500 000
0
0
0
0
0
0.00
8
over 500 000
0
0
0
0
0
0.00
Legal Acts
Documents
Electoral Bodies
Election Committees
Turnout
Results
Statistical Data
SENATE
PRESIDENT
Created by
Copyright [c] 2005
Mikrobit Sp. z o.o.
. All Rights Reserved.
top